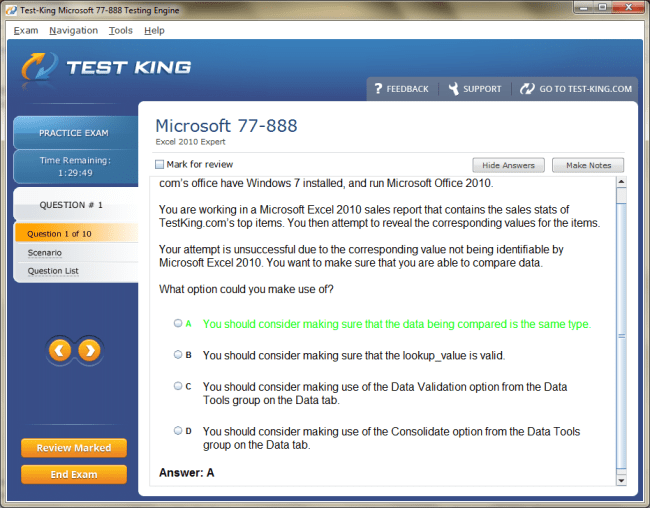
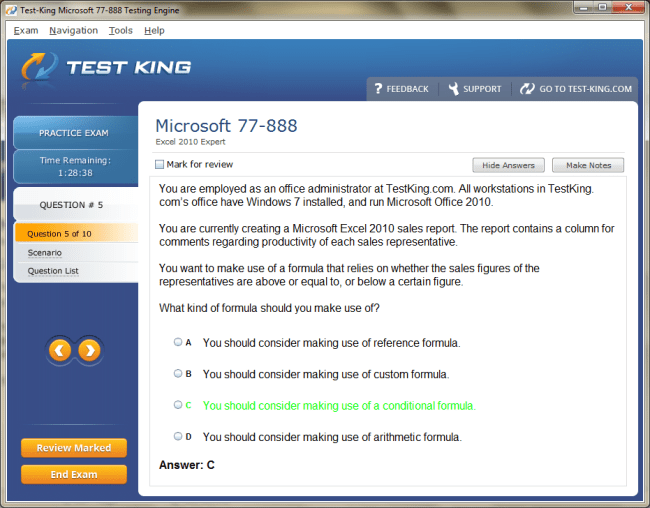
77-888 Exam Product Screenshots


Frequently Asked Questions
How can I get the products after purchase?
All products are available for download immediately from your Member's Area. Once you have made the payment, you will be transferred to Member's Area where you can login and download the products you have purchased to your computer.
How long can I use my product? Will it be valid forever?
Test-King products have a validity of 90 days from the date of purchase. This means that any updates to the products, including but not limited to new questions, or updates and changes by our editing team, will be automatically downloaded on to computer to make sure that you get latest exam prep materials during those 90 days.
Can I renew my product if when it's expired?
Yes, when the 90 days of your product validity are over, you have the option of renewing your expired products with a 30% discount. This can be done in your Member's Area.
Please note that you will not be able to use the product after it has expired if you don't renew it.
How often are the questions updated?
We always try to provide the latest pool of questions, Updates in the questions depend on the changes in actual pool of questions by different vendors. As soon as we know about the change in the exam question pool we try our best to update the products as fast as possible.
How many computers I can download Test-King software on?
You can download the Test-King products on the maximum number of 2 (two) computers or devices. If you need to use the software on more than two machines, you can purchase this option separately. Please email support@test-king.com if you need to use more than 5 (five) computers.
What is a PDF Version?
PDF Version is a pdf document of Questions & Answers product. The document file has standart .pdf format, which can be easily read by any pdf reader application like Adobe Acrobat Reader, Foxit Reader, OpenOffice, Google Docs and many others.
Can I purchase PDF Version without the Testing Engine?
PDF Version cannot be purchased separately. It is only available as an add-on to main Question & Answer Testing Engine product.
What operating systems are supported by your Testing Engine software?
Our testing engine is supported by Windows. Andriod and IOS software is currently under development.
Top Microsoft Exams
- AZ-104 - Microsoft Azure Administrator
- AZ-305 - Designing Microsoft Azure Infrastructure Solutions
- DP-700 - Implementing Data Engineering Solutions Using Microsoft Fabric
- AB-100 - Agentic AI Business Solutions Architect
- SC-300 - Microsoft Identity and Access Administrator
- MD-102 - Endpoint Administrator
- AI-900 - Microsoft Azure AI Fundamentals
- PL-300 - Microsoft Power BI Data Analyst
- AB-900 - Microsoft 365 Copilot and Agent Administration Fundamentals
- SC-401 - Administering Information Security in Microsoft 365
- MS-102 - Microsoft 365 Administrator
- SC-200 - Microsoft Security Operations Analyst
- AZ-900 - Microsoft Azure Fundamentals
- AI-102 - Designing and Implementing a Microsoft Azure AI Solution
- AZ-700 - Designing and Implementing Microsoft Azure Networking Solutions
- DP-600 - Implementing Analytics Solutions Using Microsoft Fabric
- AB-730 - AI Business Professional
- AB-731 - AI Transformation Leader
- SC-100 - Microsoft Cybersecurity Architect
- AZ-500 - Microsoft Azure Security Technologies
- GH-300 - GitHub Copilot
- PL-400 - Microsoft Power Platform Developer
- AI-103 - Developing AI Apps and Agents on Azure
- AZ-204 - Developing Solutions for Microsoft Azure
- AZ-140 - Configuring and Operating Microsoft Azure Virtual Desktop
- SC-900 - Microsoft Security, Compliance, and Identity Fundamentals
- DP-300 - Administering Microsoft Azure SQL Solutions
- AZ-400 - Designing and Implementing Microsoft DevOps Solutions
- AZ-801 - Configuring Windows Server Hybrid Advanced Services
- MS-700 - Managing Microsoft Teams
- PL-600 - Microsoft Power Platform Solution Architect
- AZ-800 - Administering Windows Server Hybrid Core Infrastructure
- MB-800 - Microsoft Dynamics 365 Business Central Functional Consultant
- PL-200 - Microsoft Power Platform Functional Consultant
- PL-900 - Microsoft Power Platform Fundamentals
- MB-330 - Microsoft Dynamics 365 Supply Chain Management
- AI-300 - Operationalizing Machine Learning and Generative AI Solutions
- MB-310 - Microsoft Dynamics 365 Finance Functional Consultant
- DP-900 - Microsoft Azure Data Fundamentals
- MB-820 - Microsoft Dynamics 365 Business Central Developer
- MB-280 - Microsoft Dynamics 365 Customer Experience Analyst
- MB-230 - Microsoft Dynamics 365 Customer Service Functional Consultant
- SC-500 - Implementing End-to-End Security Controls for Cloud and AI Workloads
- MS-721 - Collaboration Communications Systems Engineer
- DP-100 - Designing and Implementing a Data Science Solution on Azure
- GH-200 - GitHub Actions
- MB-700 - Microsoft Dynamics 365: Finance and Operations Apps Solution Architect
- AI-901 - Microsoft Azure AI Fundamentals
- DP-420 - Designing and Implementing Cloud-Native Applications Using Microsoft Azure Cosmos DB
- MB-335 - Microsoft Dynamics 365 Supply Chain Management Functional Consultant Expert
- MB-500 - Microsoft Dynamics 365: Finance and Operations Apps Developer
- GH-900 - GitHub Foundations
- PL-500 - Microsoft Power Automate RPA Developer
- DP-800 - Developing AI-Enabled Database Solutions
- MS-900 - Microsoft 365 Fundamentals
- GH-500 - GitHub Advanced Security
- DP-750 - Implementing Data Engineering Solutions Using Azure Databricks
- GH-100 - GitHub Administration
- AZ-120 - Planning and Administering Microsoft Azure for SAP Workloads
- SC-400 - Microsoft Information Protection Administrator
- MB-240 - Microsoft Dynamics 365 for Field Service
- DP-203 - Data Engineering on Microsoft Azure
- 98-382 - Introduction to Programming Using JavaScript
- MO-200 - Microsoft Excel (Excel and Excel 2019)
- MS-203 - Microsoft 365 Messaging
- MB-910 - Microsoft Dynamics 365 Fundamentals Customer Engagement Apps (CRM)
- 98-367 - Security Fundamentals
- 98-383 - Introduction to Programming Using HTML and CSS
77-888: Mastering Lookup Functions in Excel 2010 Expert Exam
Advanced Excel functions are indispensable tools for anyone preparing for the 77-888 certification. Among these, lookup functions hold a preeminent position due to their versatility in data analysis and management. Lookup functions allow users to locate specific information within extensive datasets, transforming raw information into structured insights. In Excel 2010 Expert, functions like VLOOKUP, HLOOKUP, INDEX, and MATCH offer a robust framework for handling complex spreadsheets with precision. Mastery of these functions not only streamlines tasks but also enhances the analytical acumen necessary for professional tasks and certification success.
Understanding the Role of Lookup Functions
Lookup functions facilitate the correlation of data across multiple ranges. They are particularly vital when working with voluminous data where manual searching would be impractical. For instance, retrieving employee records, calculating product inventories, or analyzing financial reports becomes significantly more efficient with these functions. Excel’s dynamic nature allows these functions to interact seamlessly with other advanced tools like PivotTables and conditional formulas, enabling multifaceted analysis without resorting to cumbersome manual methods. Understanding the nuances of each lookup function is crucial to achieving expert-level proficiency.
VLOOKUP and HLOOKUP for Data Retrieval
VLOOKUP, or vertical lookup, is one of the most commonly utilized functions for finding data in columns. It operates by searching for a specific value in the leftmost column of a defined range and returning a corresponding value from a specified column in the same row. In professional scenarios, VLOOKUP is instrumental for reconciling large datasets, matching product codes to descriptions, or linking sales records to financial data. The function’s efficiency lies in its ability to quickly navigate through thousands of entries and extract exact information without the risk of human error.
HLOOKUP, the horizontal counterpart of VLOOKUP, searches data in rows rather than columns. This function is particularly useful when datasets are organized horizontally, such as monthly sales figures or quarterly performance metrics. When combined with precise referencing techniques, HLOOKUP can be leveraged to construct dynamic reports that adjust automatically as data changes, which is a core requirement for Excel 2010 Expert tasks. Both VLOOKUP and HLOOKUP are invaluable in automating repetitive lookup operations, significantly reducing the cognitive load on analysts.
The precision of these functions can be enhanced by understanding their limitations and optimizing their usage. For instance, VLOOKUP may return inaccurate results if the search key is not properly sorted or if the function relies on approximate matches unnecessarily. Excel experts often circumvent this limitation by employing exact match parameters or integrating auxiliary functions that validate data integrity. By mastering these subtleties, candidates preparing for the 77-888 certification can exhibit a level of proficiency that distinguishes them in professional environments.
Harnessing INDEX and MATCH for Flexibility
While VLOOKUP and HLOOKUP offer straightforward data retrieval, INDEX and MATCH provide a higher degree of flexibility. The INDEX function returns the value of a cell within a specific row and column of a range, while MATCH identifies the position of a value within a range. When combined, these functions allow complex lookups that surpass the limitations of traditional vertical or horizontal searches.
This combination proves especially effective in scenarios where datasets are multidimensional or require cross-referencing multiple criteria. For instance, an analyst may need to retrieve a sales figure for a particular product sold in a specific region during a certain quarter. Using INDEX and MATCH together enables a dynamic search that can adapt to changes in the dataset without rewriting formulas. Excel 2010 Expert users often employ this combination to design dashboards, automate reporting, and ensure that data retrieval remains accurate and efficient under varying conditions.
The power of INDEX and MATCH lies not only in their flexibility but also in their resilience to structural changes in datasets. Unlike VLOOKUP, which may fail if columns are rearranged, the INDEX and MATCH combination maintains accuracy even when the layout of data evolves. This robustness is a key differentiator in advanced Excel functions and an essential skill for those pursuing Microsoft certification.
Practical Applications in Data Analysis
In professional practice, the application of lookup functions extends beyond mere retrieval of data. These functions serve as the foundation for analytical processes that transform raw datasets into actionable intelligence. By integrating VLOOKUP, HLOOKUP, INDEX, and MATCH into a coherent workflow, users can perform complex analyses such as trend identification, anomaly detection, and performance benchmarking. Excel 2010 Expert certification emphasizes not only technical ability but also the capacity to leverage these functions to generate insights that support decision-making processes.
For example, in human resources management, lookup functions can automatically match employee identifiers with performance scores, attendance records, and compensation details. This enables managers to identify high performers, monitor productivity trends, and forecast staffing needs with unprecedented accuracy. Similarly, in financial reporting, lookup functions streamline the reconciliation of ledger entries, expense tracking, and budget forecasting, allowing accountants to produce precise reports efficiently. These real-world applications underscore the relevance of lookup functions in professional environments and highlight their critical role in the 77-888 certification.
Advanced users often integrate lookup functions with conditional logic to create dynamic reports. Functions such as IF, AND, and OR can be combined with VLOOKUP or INDEX-MATCH to execute sophisticated data queries that adapt to changing conditions. For instance, a formula can be constructed to extract sales data only for transactions above a specific threshold or to highlight inconsistencies across multiple datasets. Such capabilities exemplify the analytical depth expected of Excel 2010 Expert candidates.
Enhancing Accuracy and Efficiency
Accuracy is paramount when performing lookups in large datasets. Errors can propagate rapidly, leading to misleading conclusions and faulty decision-making. Excel offers tools that enhance the reliability of lookup operations, such as data validation, error-handling functions, and structured referencing. Data validation ensures that search keys adhere to expected formats, while error-handling functions like IFERROR allow the graceful management of missing or incorrect data. Structured references, particularly in tables, enable formulas to adapt automatically as datasets expand or contract, minimizing the risk of human error.
Efficiency, in parallel, is cultivated through thoughtful design of lookup formulas. Named ranges, dynamic ranges, and the use of absolute and relative references contribute to creating formulas that are not only accurate but also easily maintainable. Excel 2010 Expert users are expected to optimize both the performance and readability of their formulas, ensuring that complex lookups remain transparent and interpretable by colleagues or auditors. This dual emphasis on accuracy and efficiency is central to advanced spreadsheet management and is heavily emphasized in the certification exam.
Integrating Lookup Functions with Other Excel Features
The true power of lookup functions emerges when they are integrated with other advanced Excel features. PivotTables, for example, can be enhanced by lookup functions to produce more insightful summaries. While PivotTables aggregate and display data effectively, lookup functions can enrich them by dynamically linking additional information, such as product descriptions, client details, or regional metrics. Similarly, charts and dashboards gain clarity and depth when lookup functions supply the underlying data, enabling visuals that respond dynamically to changes in the dataset.
Macros and automation further amplify the utility of lookup functions. By recording repetitive lookup operations within macros, Excel experts can automate routine tasks, saving substantial time and reducing the likelihood of error. This capability exemplifies the level of mastery expected in the 77-888 certification, where proficiency is measured not only by technical execution but also by the ability to streamline workflows and enhance productivity.
Strategies for Mastery
Attaining mastery over lookup functions requires both conceptual understanding and practical application. Regular practice on diverse datasets helps internalize the logic and syntax of each function. Simulating real-world scenarios, such as financial reconciliation, inventory management, or employee performance tracking, reinforces the practical relevance of these functions. Additionally, exploring edge cases, such as missing data, duplicate entries, and dynamic ranges, prepares candidates for the nuanced challenges encountered in the Excel 2010 Expert exam.
Engaging with community resources, tutorials, and professional forums can also deepen understanding. Experienced practitioners often share rare insights, unconventional techniques, and novel approaches to problem-solving that enhance proficiency beyond standard coursework. Familiarity with these approaches equips certification candidates to handle complex and unforeseen scenarios, reinforcing the analytical agility expected of Excel 2010 Expert users.
In essence, lookup functions form the bedrock of advanced Excel expertise. Their mastery empowers users to navigate, analyze, and interpret extensive datasets with confidence, precision, and efficiency. For those aspiring to achieve Microsoft certification, proficiency in these functions is not merely an academic requirement but a practical asset that elevates professional capability and problem-solving acumen. By immersing oneself in the intricate workings of VLOOKUP, HLOOKUP, INDEX, and MATCH, and integrating them thoughtfully with other Excel features, users unlock the full potential of Excel 2010 as a transformative analytical tool.
Understanding PivotTables and Their Importance
PivotTables are among the most potent tools in Excel 2010 Expert, allowing users to transform extensive and seemingly unstructured datasets into insightful summaries and interactive reports. The capability to dynamically reorganize, analyze, and visualize data sets PivotTables apart from conventional spreadsheet techniques. In professional contexts, PivotTables enable analysts, accountants, and managers to uncover trends, anomalies, and correlations that would otherwise remain obscured within voluminous data.
Excel 2010 Expert certification emphasizes not only the technical proficiency required to create PivotTables but also the analytical judgment needed to deploy them effectively. PivotTables can condense thousands of rows into concise, readable formats, allowing decision-makers to focus on the most relevant aspects of data. Their flexibility makes them ideal for diverse applications, including financial reporting, sales performance analysis, human resources evaluation, and inventory management.
The architecture of PivotTables is predicated on the concept of fields and items. Fields represent columns from the original dataset, while items correspond to the individual entries within those columns. By dragging and dropping fields into the various areas of a PivotTable, users can instantly reorganize the data to produce meaningful summaries, whether through totals, averages, counts, or percentages. The dynamic nature of PivotTables ensures that even as datasets expand or evolve, summaries can be updated without manual recalculation, an essential aspect for any Excel 2010 Expert preparing for certification.
Creating Dynamic PivotTables
Constructing a PivotTable begins with identifying the dataset and understanding the desired analytical outcome. Users must consider which fields will serve as row labels, column labels, values, or filters. For instance, in a sales analysis scenario, product names might be assigned as row labels, regions as column labels, and total sales as the values. Additional filters, such as date ranges or customer segments, refine the results, providing granular insights. The ability to design PivotTables that convey the intended narrative while remaining responsive to dataset changes is a hallmark of Excel expertise.
Advanced users often leverage calculated fields to extend the analytical capability of PivotTables. These fields are derived from existing data and allow for computations such as profit margins, growth percentages, or performance indices. Calculated fields enable users to incorporate complex metrics without altering the underlying dataset, ensuring data integrity while enhancing interpretive power. This capability is particularly valuable when preparing for scenarios likely to appear in the 77-888 certification, where nuanced understanding of data relationships is tested.
Grouping within PivotTables enhances analytical clarity by consolidating data into meaningful categories. For instance, numerical values can be grouped into ranges, dates can be grouped into months, quarters, or years, and textual data can be clustered according to logical hierarchies. Grouping allows analysts to detect patterns and trends that may not be apparent when viewing raw data. Excel 2010 Expert candidates who master these grouping techniques demonstrate an ability to extract higher-order insights from complex datasets, a skill critical in professional and certification contexts.
Summarizing and Filtering Data
PivotTables provide powerful summarization capabilities that extend beyond simple aggregation. Users can choose from a variety of functions, including sum, average, count, maximum, minimum, and standard deviation, depending on the analytical objective. This versatility ensures that PivotTables are suitable for a broad spectrum of analytical tasks, from basic performance tracking to intricate statistical analysis.
Filters in PivotTables allow for dynamic exploration of subsets within the data. Report filters, for example, enable the examination of specific categories or time periods without modifying the primary table. Similarly, slicers provide intuitive, visual filtering options that enhance interactivity and accessibility. By employing these filtering techniques, Excel 2010 Expert users can create interactive reports that respond to user inputs, supporting decision-making processes in real time.
Sorting within PivotTables is equally important for effective data interpretation. Data can be arranged alphabetically, numerically, or according to custom sequences, allowing critical trends and outliers to be identified swiftly. Sorting in combination with grouping and filtering transforms PivotTables into highly flexible instruments for analysis, capable of handling diverse datasets and evolving business requirements. Certification candidates are expected to demonstrate proficiency in these operations as they reflect both technical skill and analytical judgment.
Integrating PivotTables with Other Excel Features
The true potential of PivotTables is realized when integrated with other advanced Excel features. Lookup functions can enrich PivotTables by supplying supplementary information such as descriptions, client details, or categorical classifications. Conditional formatting applied to PivotTable values allows for instant visual emphasis on key trends or discrepancies. These enhancements transform standard summaries into comprehensive analytical tools capable of conveying sophisticated narratives.
PivotCharts complement PivotTables by providing graphical representations of summarized data. Excel 2010 Expert users can create charts that respond dynamically to changes in the PivotTable, offering interactive dashboards that facilitate deeper understanding. The integration of PivotTables and PivotCharts is invaluable for executives and stakeholders who rely on visually compelling presentations to make informed decisions. This combination of analytical precision and visual clarity exemplifies the level of expertise expected in professional practice and certification scenarios.
Automation and macros further augment the functionality of PivotTables. Repetitive tasks such as generating monthly summaries, updating datasets, and formatting reports can be streamlined using recorded or programmed macros. This capability not only saves time but also reduces the potential for human error, reinforcing the reliability of analytical outputs. Mastery of these automated workflows is a distinguishing feature of Excel 2010 Expert users, particularly those preparing for certification exams that assess practical problem-solving abilities.
Advanced Techniques for Data Insight
Excel 2010 Expert certification challenges candidates to utilize PivotTables for sophisticated data exploration. Techniques such as multi-level nesting, calculated items, and advanced filtering enable users to interrogate data with precision. Multi-level nesting allows multiple fields to be placed within rows or columns, revealing intricate hierarchies and interrelationships. Calculated items permit customized computations within a single field, expanding the analytical depth beyond default aggregation functions.
Conditional filtering within PivotTables can be applied to identify exceptional values, trends, or patterns. For example, an analyst might filter for sales figures exceeding a specified threshold or for products contributing disproportionately to revenue. Such conditional analysis is pivotal for decision-making, enabling organizations to allocate resources efficiently and respond proactively to emerging opportunities or challenges.
Advanced users also explore dynamic ranges and named ranges to ensure that PivotTables adapt automatically as new data is incorporated. By defining dynamic ranges, users eliminate the need for constant manual adjustments, creating resilient analytical frameworks suitable for continuously evolving datasets. This adaptability is central to the proficiency expected in the Excel 2010 Expert exam, as it reflects both technical mastery and practical foresight.
Practical Applications in Professional Environments
PivotTables are employed across myriad professional domains, from finance and marketing to operations and human resources. In finance, analysts use PivotTables to reconcile accounts, track expenses, and monitor budget adherence. Marketing professionals leverage PivotTables to evaluate campaign performance, customer segmentation, and market trends. Operations managers apply PivotTables to monitor inventory, production metrics, and supply chain efficiency. The versatility and dynamism of PivotTables make them indispensable in any domain where data-driven decision-making is critical.
For example, a retail company might use PivotTables to analyze sales across regions, product categories, and time periods simultaneously. By grouping data by months and quarters, applying filters to isolate top-performing products, and summarizing with averages and percentages, management gains a holistic view of business performance. This capability to distill complex datasets into actionable intelligence exemplifies the professional utility of PivotTables and underscores their importance for Excel 2010 Expert certification aspirants.
PivotTables also facilitate collaborative analysis. Reports can be designed to accommodate multiple stakeholders, with interactive filters and slicers allowing each user to explore data relevant to their domain. This interactivity ensures that analytical outputs are not static but adaptable, promoting informed decision-making across departments. Excel 2010 Expert users who can design such responsive and versatile reports demonstrate a level of sophistication that extends beyond basic spreadsheet proficiency.
Strategies for Expert Mastery
Mastering PivotTables requires deliberate practice and exploration of diverse datasets. Candidates should experiment with varying data structures, field arrangements, and analytical objectives to build versatility. Understanding the implications of different aggregation methods, filter applications, and grouping strategies is critical for producing accurate and insightful reports. Additionally, simulating real-world scenarios, such as financial reconciliations, sales trend analysis, or operational performance tracking, helps internalize the practical applications of PivotTables.
Exploring unconventional features, such as calculated items, custom grouping, and integration with external data sources, provides an edge for Excel 2010 Expert certification candidates. Engaging with professional communities, tutorials, and case studies exposes users to rare techniques and innovative approaches that enhance analytical agility. These experiences cultivate a mindset attuned to precision, efficiency, and adaptability, qualities essential for both certification success and professional excellence.
Ultimately, proficiency in PivotTables empowers users to navigate complex datasets with confidence and clarity. The ability to synthesize data, uncover patterns, and generate interactive reports distinguishes Excel 2010 Expert users in both examination and workplace contexts. By mastering these techniques and integrating them thoughtfully with other Excel functionalities, candidates position themselves as capable analysts, adept at transforming data into actionable intelligence and strategic insight.
Elevating Analytical Proficiency with Advanced Functions
Advanced data analysis in Excel 2010 Expert requires not only an understanding of fundamental formulas but also the capability to apply sophisticated functions and tools to extract meaningful insights from complex datasets. Excel serves as a powerful analytical instrument, and mastery of its advanced features equips professionals to navigate vast amounts of information efficiently. From conditional calculations to what-if scenarios, data validation, and dynamic reporting, the spectrum of advanced techniques enhances the analytical rigor demanded by professional environments and Microsoft certification.
The importance of advanced analytical skills lies in their capacity to transform raw, unstructured data into actionable intelligence. Analysts, managers, and decision-makers increasingly rely on these techniques to identify trends, forecast outcomes, and support strategic planning. In preparing for the 77-888 certification, candidates are expected to demonstrate the ability to construct models, perform nuanced analyses, and integrate multiple Excel features into coherent workflows that yield precise results.
Conditional Analysis for Insightful Decision Making
Conditional analysis is one of the most versatile tools in the Excel 2010 Expert repertoire. Functions such as IF, nested IF, AND, OR, and conditional aggregation allow users to perform calculations based on specific criteria. These functions are indispensable for filtering data, segmenting results, and highlighting key performance indicators. For example, a sales manager can create formulas that calculate bonuses only for employees exceeding certain sales targets, or an operations analyst can flag inventory levels below a predefined threshold. The ability to implement conditional logic with accuracy and efficiency distinguishes expert-level proficiency.
Advanced practitioners combine conditional functions with lookup mechanisms and dynamic references to construct multifaceted models. This integration enables conditional retrieval of data from multiple ranges, allowing for precise analysis even in sprawling datasets. Excel 2010 Expert users leverage these capabilities to automate decision-making processes, reduce manual intervention, and enhance the reliability of outputs. Conditional analysis, therefore, serves not only as a computational tool but also as a strategic instrument for effective data interpretation.
Utilizing What-If Analysis for Forecasting
What-if analysis is an essential technique for exploring hypothetical scenarios and understanding their potential impact on business outcomes. Excel 2010 Expert provides a suite of what-if tools, including Goal Seek, Scenario Manager, and Data Tables, each offering unique ways to examine the interplay between variables. Goal Seek allows analysts to determine the necessary input to achieve a desired result, such as adjusting pricing to meet revenue targets. Scenario Manager enables the comparison of multiple possible outcomes based on different assumptions, fostering a deeper understanding of risks and opportunities.
Data Tables, both one-variable and two-variable, facilitate dynamic exploration of interdependencies within datasets. By manipulating input values and observing resultant changes, analysts can anticipate trends, evaluate strategies, and make informed decisions. These tools are particularly valuable in financial modeling, budgeting, and resource allocation, where minor adjustments can have substantial implications. Mastery of what-if analysis demonstrates the capacity to think critically, model complex systems, and respond to uncertainty—a quality highly valued in Excel 2010 Expert certification.
Data Validation for Accuracy and Consistency
Ensuring data integrity is paramount in advanced Excel analysis. Data validation enables users to restrict inputs, enforce consistency, and prevent errors before they propagate through calculations. By defining criteria such as numeric ranges, text length, dates, or custom formulas, analysts can maintain high-quality datasets that support reliable conclusions. For example, a human resources analyst might enforce valid employee identification numbers, or a financial planner might restrict input values to acceptable budget ranges. These measures safeguard the analytical process and reduce the likelihood of inaccurate reporting.
Beyond basic restrictions, Excel 2010 Expert users employ data validation creatively to enhance interactivity and usability. Drop-down lists, for instance, allow users to select from predefined options, simplifying data entry while ensuring uniformity. Dependent validation rules, where one input influences another, add layers of sophistication and flexibility to data management. Such practices exemplify the meticulous approach expected from advanced Excel practitioners and underscore the professional discipline required for certification excellence.
Complex Formulas and Array Techniques
Advanced data analysis frequently relies on complex formulas that combine multiple functions to achieve nuanced results. Nested functions, including combinations of logical, lookup, and mathematical operations, empower users to tackle sophisticated analytical challenges. For example, a finance professional might use nested functions to calculate variable commission rates based on multiple thresholds, while an operations manager could compute weighted averages across dynamic ranges. The ability to design, debug, and optimize such formulas is a hallmark of Excel 2010 Expert proficiency.
Array formulas further extend analytical capabilities by performing calculations on multiple values simultaneously. These formulas allow for aggregate computations, conditional summations, and multi-criteria analysis without requiring additional helper columns. Advanced Excel users exploit array techniques to simplify workflows, minimize redundancy, and achieve computational elegance. Mastery of array formulas reflects both technical skill and conceptual understanding, positioning candidates for success in certification assessments and real-world analytical tasks.
Integration with Lookup Functions
Advanced data analysis techniques are most effective when integrated with lookup functions such as VLOOKUP, HLOOKUP, INDEX, and MATCH. Combining these tools allows analysts to retrieve data conditionally, cross-reference multiple datasets, and construct dynamic models. For instance, a sales analyst could employ an INDEX-MATCH combination to extract quarterly performance metrics for specific products while simultaneously applying conditional logic to calculate bonuses or targets. The synergy between lookup functions and advanced analytical techniques enables the construction of resilient models that adapt to evolving datasets and analytical requirements.
This integration is particularly valuable when dealing with multidimensional data, where relationships between fields must be evaluated simultaneously. By harnessing the combined power of lookups, conditional functions, and array techniques, Excel 2010 Expert users can generate precise, flexible, and efficient analytical frameworks. This capability not only streamlines workflows but also enhances the interpretive depth of reports, providing decision-makers with actionable insights grounded in accurate data.
Visualization and Analytical Storytelling
Data analysis extends beyond computation into the realm of visualization and storytelling. Advanced Excel techniques enable users to create compelling visual narratives that clarify complex patterns and highlight critical trends. Conditional formatting, for example, can be applied to emphasize outliers, growth rates, or deviations from targets, allowing decision-makers to grasp key insights at a glance. By combining conditional rules with dynamic ranges, analysts ensure that visual cues update automatically as underlying data changes, enhancing interpretive accuracy.
Charts and sparklines complement numerical analysis by presenting trends, distributions, and comparisons in a visually intuitive manner. Advanced Excel users integrate analytical formulas with charting tools to produce dashboards that combine quantitative rigor with visual clarity. These dashboards serve as interactive platforms where stakeholders can explore data from multiple angles, supporting informed decisions in real time. The ability to weave analysis into a coherent visual story is a defining feature of expert-level proficiency and a critical expectation for Excel 2010 Expert certification.
Practical Applications Across Industries
Advanced data analysis techniques find utility across numerous professional domains. In finance, analysts employ complex formulas, scenario modeling, and conditional logic to evaluate investments, forecast budgets, and reconcile accounts. Marketing professionals leverage data validation, lookup integration, and dynamic dashboards to monitor campaign performance, analyze customer segmentation, and predict trends. Operations and supply chain managers utilize array formulas, grouping, and scenario analysis to optimize production schedules, manage inventory, and reduce inefficiencies. The versatility of these techniques underscores their indispensable role in professional environments.
For instance, a multinational corporation might use advanced Excel techniques to consolidate sales data from multiple regions, perform conditional analysis to identify top-performing territories, and model future scenarios based on seasonal trends. By integrating lookup functions, array formulas, and conditional logic, analysts create resilient models that remain accurate even as new data is introduced. This capacity to manage, interpret, and visualize complex datasets is central to the expertise expected in both certification and workplace contexts.
Enhancing Efficiency and Reliability
Efficiency and reliability are twin pillars of advanced Excel analysis. Complex tasks can be executed rapidly by employing structured approaches, reusable formulas, and automated workflows. Named ranges, dynamic references, and template-based models reduce manual intervention and minimize errors. Additionally, error-handling functions allow analysts to manage anomalies gracefully, ensuring that outputs remain robust under varying conditions. Excel 2010 Expert users are expected to demonstrate mastery of these techniques, balancing analytical sophistication with operational reliability.
Automation, including the use of macros, further augments efficiency by replicating repetitive analytical processes without compromising accuracy. Analysts can record workflows that incorporate lookup functions, conditional logic, and array calculations, creating reusable models that save substantial time. This capability not only improves productivity but also ensures that complex analyses are reproducible, transparent, and auditable, which is crucial for professional standards and certification expectations.
Developing Expertise Through Practice
Achieving proficiency in advanced data analysis requires deliberate practice with diverse datasets and real-world scenarios. Candidates preparing for Excel 2010 Expert certification should engage with financial models, sales tracking systems, human resource databases, and operational logs to internalize techniques and understand their applications. Experimenting with different combinations of functions, testing edge cases, and exploring dynamic references builds the analytical agility necessary for professional excellence.
Exposure to unconventional datasets, such as those with missing values, irregular formats, or multidimensional hierarchies, enhances problem-solving skills. Advanced users develop strategies to handle anomalies, optimize formulas, and maintain data integrity even under challenging conditions. Engaging with professional communities, tutorials, and case studies further enriches understanding, providing insights into rare techniques and innovative approaches that extend beyond standard coursework.
Mastery of advanced data analysis in Excel 2010 Expert encompasses not only technical execution but also analytical judgment. Users must determine which functions to apply, how to structure models, and how to present insights effectively. This blend of computational skill and interpretive acumen is the hallmark of expert-level proficiency and is essential for both certification success and professional impact.
Harnessing the Power of Macros
Macros are among the most transformative tools in Excel 2010 Expert, enabling users to automate repetitive tasks, streamline workflows, and enhance productivity. By recording sequences of actions or operations, macros allow analysts and professionals to execute complex procedures with a single command. This functionality is particularly crucial for Excel 2010 Expert certification, where candidates are expected to demonstrate both technical proficiency and an ability to manage extensive datasets efficiently. Macros serve as a bridge between manual data handling and sophisticated automation, empowering users to achieve consistent and error-free results.
The essence of macros lies in their ability to replicate operations exactly as performed by the user. Whether formatting a report, consolidating data, performing calculations, or generating summaries, macros capture each step, creating a reusable script that can be executed repeatedly. For professionals managing large volumes of information, this capability drastically reduces the time required to complete tasks, while simultaneously minimizing the risk of human error. Excel 2010 Expert users often integrate macros with other advanced functions, such as lookup formulas, conditional analysis, and PivotTables, to construct automated models capable of handling intricate analytical processes.
Creating and Managing Macros
The process of creating macros begins with careful planning to identify repetitive tasks that can be automated. Users record their actions using the macro recorder, which captures keystrokes, mouse clicks, and cell references. Advanced practitioners may edit and fine-tune macros to improve efficiency or expand their functionality. The ability to manage and organize macros is critical, as large datasets often require multiple automation scripts operating in harmony. Excel 2010 Expert certification evaluates candidates not only on their ability to record macros but also on their capacity to design logical, maintainable, and adaptable automation workflows.
Macros can be stored within individual workbooks or the personal macro workbook, allowing reuse across different files. Expert users strategically organize macros with descriptive names and annotations to ensure clarity and maintainability. In professional environments, proper macro management is essential to maintain consistency, facilitate collaboration, and reduce the risk of operational errors. Certification aspirants are expected to demonstrate awareness of best practices for macro management, highlighting both technical knowledge and professional discipline.
Automating Repetitive Calculations and Reports
One of the most powerful applications of macros is the automation of repetitive calculations and reporting tasks. Financial analysts, for instance, frequently need to reconcile accounts, generate monthly reports, or consolidate data from multiple sources. By automating these operations with macros, they can ensure consistency, accuracy, and timely delivery. Macros can execute complex sequences of calculations, apply conditional formatting, filter data, and even prepare charts or summaries, all without manual intervention. This level of efficiency exemplifies the analytical agility and technical expertise expected of Excel 2010 Expert users.
In addition to calculations, macros are invaluable for automating the preparation of standardized reports. Operations managers might use macros to generate inventory summaries for multiple warehouses, while marketing analysts could automate the creation of campaign performance dashboards. These automated workflows save substantial time, reduce human error, and allow professionals to focus on higher-order analysis rather than repetitive manual tasks. Mastery of this capability is a distinctive characteristic of those achieving certification and demonstrates practical application of advanced Excel knowledge.
Integrating Macros with Other Excel Functions
The effectiveness of macros is amplified when integrated with other advanced Excel functions. For example, macros can interact with lookup functions such as VLOOKUP, HLOOKUP, INDEX, and MATCH to dynamically retrieve and manipulate data. Conditional logic within macros allows for selective execution of tasks, depending on dataset values or criteria. PivotTables and charts can be refreshed, formatted, and analyzed automatically through macro scripts, creating fully automated analytical pipelines. This integration underscores the depth of expertise required in Excel 2010 Expert certification, where proficiency is measured by the ability to combine multiple tools into cohesive, efficient workflows.
Dynamic reporting is another area where macros demonstrate their transformative potential. By linking macros with named ranges, structured tables, and conditional formatting, analysts can create interactive dashboards that update automatically as new data is introduced. These automated dashboards provide decision-makers with real-time insights, enhancing organizational responsiveness and operational efficiency. Excel 2010 Expert users who master such integration can develop analytical solutions that are both robust and adaptable, reflecting advanced problem-solving capabilities.
Enhancing Efficiency Through Automation
Automation through macros enhances efficiency in both routine and complex analytical tasks. Repetitive operations, such as formatting, data consolidation, and report generation, can be executed in seconds, freeing analysts to focus on interpretation, decision-making, and strategic analysis. Efficiency gains are particularly significant when working with large or frequently updated datasets, where manual operations would be time-consuming and error-prone. By automating these processes, Excel 2010 Expert users ensure that outputs are consistent, reliable, and produced in a fraction of the time required for manual execution.
Error reduction is another critical advantage of automation. Macros perform tasks exactly as programmed, eliminating inconsistencies caused by human oversight. This reliability is vital in professional environments where accuracy and precision are paramount, such as financial reporting, inventory management, and operational analytics. Excel 2010 Expert certification emphasizes the practical application of these principles, expecting candidates to demonstrate the ability to create automated workflows that maintain high standards of accuracy and reliability.
Advanced Macro Techniques
Expert-level users extend macro functionality through advanced techniques, enhancing flexibility, efficiency, and adaptability. Loops and conditional structures within macros allow for iterative operations and decision-based execution, making automation scripts capable of handling complex, variable datasets. Integration with array formulas, dynamic ranges, and structured references ensures that macros can adapt to changes in dataset size or structure without requiring constant modification. These advanced techniques reflect a higher echelon of Excel proficiency, essential for both certification and real-world professional performance.
Error handling is another advanced aspect of macro design. By incorporating checks for missing or invalid data, Excel 2010 Expert users can create robust automation that gracefully manages anomalies. This ensures that workflows continue uninterrupted, even when datasets contain unexpected values or inconsistencies. Such foresight exemplifies the level of precision and professionalism expected in expert-level Excel practice and underscores the importance of meticulous planning in automation design.
Practical Applications Across Domains
Macros and automation find practical applications across a wide array of industries and professional functions. In finance, they streamline account reconciliation, budget preparation, and cash flow analysis. Marketing professionals leverage automation to generate performance reports, analyze customer engagement trends, and update campaign dashboards with minimal manual intervention. Operations managers apply macros to monitor production metrics, consolidate inventory data, and automate resource allocation. This versatility illustrates the indispensable role of automation in enhancing productivity, accuracy, and decision-making.
For example, a multinational company might employ macros to automate the consolidation of monthly sales reports from various regional offices. The macro could apply formatting, summarize totals, highlight discrepancies, and generate visual summaries without requiring repeated manual effort. Such capabilities demonstrate the practical value of macros in managing complex operations and highlight their relevance for Excel 2010 Expert certification, where candidates are expected to exhibit both technical skill and operational insight.
Developing Expertise in Automation
Achieving mastery in macros and automation requires deliberate practice and exploration of diverse scenarios. Candidates should identify repetitive tasks within their workflows, experiment with recording and editing macros, and refine scripts to enhance efficiency and adaptability. Exposure to dynamic datasets, multi-step processes, and integrated analytical models builds both technical proficiency and problem-solving acumen. Excel 2010 Expert users who cultivate these skills can design automation solutions that are resilient, flexible, and aligned with organizational objectives.
Engaging with professional resources, forums, and case studies further enriches understanding, exposing users to rare techniques and unconventional approaches to automation. For instance, learning how to integrate macros with conditional logic, lookup functions, and PivotTables allows users to construct comprehensive analytical pipelines. This knowledge not only prepares candidates for certification challenges but also equips them to deliver tangible value in professional contexts.
Ultimately, proficiency in macros and automation transforms the way analysts and professionals interact with Excel. By reducing manual effort, enhancing accuracy, and enabling dynamic reporting, automation elevates both productivity and analytical insight. Mastery of these techniques distinguishes Excel 2010 Expert users, reflecting a combination of technical skill, strategic thinking, and operational efficiency that is highly valued in certification assessments and real-world applications.
Transforming Data into Insightful Visuals
Data visualization is a critical skill in Excel 2010 Expert, enabling professionals to interpret complex datasets, communicate trends, and support decision-making with clarity. Charts and dashboards serve as visual instruments that translate numerical information into comprehensible stories, allowing analysts to identify patterns, anomalies, and correlations that might otherwise remain hidden. Advanced visualization techniques are not merely decorative; they are analytical tools that amplify the interpretive power of spreadsheets and streamline strategic communication.
Excel 2010 Expert emphasizes not only the technical creation of charts but also the thoughtful design of dashboards that combine multiple visual elements into coherent analytical narratives. Visualization transforms raw datasets into interactive and dynamic displays, allowing users to explore data dimensions intuitively. Charts and dashboards complement other advanced functions, including lookup formulas, PivotTables, conditional analysis, and macros, forming a comprehensive analytical ecosystem that supports professional and certification objectives.
Choosing the Appropriate Chart Type
Selecting the correct chart type is foundational to effective visualization. Column and bar charts are ideal for comparing discrete categories, while line charts highlight trends over time. Pie charts provide insights into proportional relationships, although they should be used judiciously to avoid misinterpretation. Scatter plots reveal correlations and distributions, and combination charts allow multiple datasets to be presented simultaneously for comparative analysis. The choice of chart type must align with the analytical objective, ensuring that the visualization communicates the intended message with precision and clarity.
In professional applications, selecting chart types often involves considering both audience and context. Financial analysts might prefer line charts to track stock performance over quarters, while operations managers may use bar charts to compare production metrics across facilities. Marketing analysts could employ combination charts to juxtapose campaign reach and conversion rates. Excel 2010 Expert users are expected to demonstrate discernment in chart selection, applying analytical reasoning to ensure that each visualization serves a clear and actionable purpose.
Customizing Charts for Clarity and Impact
Beyond selecting the appropriate type, charts must be customized to enhance readability, interpretive value, and aesthetic coherence. Axis titles, data labels, legends, and color schemes can be adjusted to highlight key insights and improve comprehension. Advanced practitioners often leverage conditional formatting in conjunction with charts to emphasize critical trends or deviations. For example, highlighting sales figures that exceed targets or marking underperforming regions allows decision-makers to focus on areas of concern without sifting through extensive data tables.
Customizing charts also involves controlling scale, range, and granularity to ensure that patterns are visible and interpretable. Analysts may adjust axis intervals, apply logarithmic scales, or manipulate grouping to clarify trends. These refinements transform generic visualizations into precise analytical instruments capable of supporting strategic decisions. Excel 2010 Expert candidates are expected to demonstrate not only technical execution but also an understanding of how design choices influence interpretive effectiveness.
Building Interactive Dashboards
Dashboards integrate multiple visualizations and analytical elements into a single interactive interface, offering a holistic view of organizational performance. Excel 2010 Expert users design dashboards that combine charts, PivotTables, conditional formatting, and data controls such as slicers and drop-down lists to create dynamic analytical environments. Interactive dashboards allow users to filter, sort, and manipulate data on the fly, revealing insights across different dimensions and timeframes. This interactivity is particularly valuable in executive reporting, where stakeholders require concise yet flexible representations of complex datasets.
Effective dashboard design involves strategic arrangement of visual components, careful selection of metrics, and thoughtful incorporation of interactive elements. Analysts often group related charts and tables, maintain consistent color schemes, and prioritize critical information to guide user attention. Excel 2010 Expert certification evaluates candidates on their ability to construct dashboards that are not only visually appealing but also functionally robust, capable of facilitating real-time exploration and decision-making.
Integrating Data with Charts and Dashboards
Charts and dashboards derive their value from the underlying data, and Excel 2010 Expert users must ensure that data integration is accurate, dynamic, and resilient. Lookup functions, such as VLOOKUP, HLOOKUP, INDEX, and MATCH, can supply charts with dynamically retrieved data, while macros automate the process of updating visuals as datasets expand or change. PivotTables provide aggregated summaries that feed directly into dashboards, allowing for rapid analysis of multidimensional information. The seamless integration of these features ensures that visualizations remain current, reliable, and responsive to user needs.
Advanced users also employ dynamic ranges and named ranges to create charts that adjust automatically as new data is added. This adaptability eliminates the need for manual updates, enhances efficiency, and reduces the risk of errors. Excel 2010 Expert certification assesses candidates’ ability to construct such dynamic visualizations, highlighting the importance of both technical skill and practical foresight in professional contexts.
Conditional Visualization Techniques
Conditional visualization adds analytical depth by emphasizing critical trends, outliers, and performance thresholds. Conditional formatting can be applied to chart elements to highlight specific data points, such as sales figures exceeding targets, declining profit margins, or operational anomalies. Sparklines offer miniature trend indicators within cells, providing compact and immediate visual summaries alongside tabular data. These techniques allow analysts to convey multiple layers of information simultaneously, enhancing interpretive richness without overwhelming the viewer.
By combining conditional visualization with interactivity, Excel 2010 Expert users create analytical environments that respond dynamically to changes in input. For instance, a dashboard might highlight regions with sales below target automatically when new data is imported, or adjust trend indicators based on selected time periods. Such functionality transforms static charts into intelligent tools for ongoing analysis and decision support.
Practical Applications in Professional Settings
Charts and dashboards are utilized across diverse professional domains, reflecting their versatility and analytical power. Financial professionals employ line and column charts to track performance metrics, monitor investment trends, and evaluate budget adherence. Marketing teams utilize combination charts and interactive dashboards to analyze campaign reach, conversion rates, and customer engagement. Operations managers leverage visualizations to monitor production efficiency, inventory levels, and resource allocation. The ability to synthesize complex datasets into clear, actionable visuals is critical in all these contexts, reinforcing the value of Excel 2010 Expert proficiency.
For example, a multinational corporation might consolidate sales, marketing, and operational metrics into a single dashboard that allows executives to explore regional performance, product trends, and quarterly progress interactively. By integrating dynamic charts, conditional formatting, and automated updates, analysts provide decision-makers with a comprehensive, real-time view of organizational performance. This approach demonstrates the practical utility of advanced visualization techniques and highlights their significance for Excel 2010 Expert certification.
Enhancing Communication and Decision-Making
Visualizations serve as communication instruments, translating intricate datasets into understandable narratives. Charts and dashboards enable professionals to present analytical findings to diverse stakeholders, from technical teams to executive management. Effective visualizations distill complexity into clarity, ensuring that key insights are immediately recognizable and actionable. Excel 2010 Expert users who master this capability not only demonstrate technical proficiency but also exhibit strategic thinking, aligning analysis with organizational objectives and decision-making requirements.
In addition to clarity, dashboards foster interactive exploration, allowing stakeholders to examine data from multiple perspectives. This interactivity supports iterative decision-making, as users can filter, drill down, and compare metrics on demand. By constructing dashboards that balance analytical depth with intuitive usability, Excel 2010 Expert practitioners create tools that empower organizations to respond swiftly and strategically to emerging challenges and opportunities.
Developing Expertise Through Practice
Proficiency in charts, dashboards, and data visualization requires extensive practice and exploration of real-world datasets. Candidates preparing for Excel 2010 Expert certification should experiment with different chart types, dashboard layouts, and interactive features. Simulating business scenarios such as financial performance tracking, sales trend analysis, or operational monitoring helps internalize visualization principles and develop intuitive design judgment. Exposure to complex, multidimensional data strengthens the ability to synthesize information and present it coherently.
Engaging with professional resources, tutorials, and case studies introduces Excel 2010 Expert users to unconventional techniques, innovative design strategies, and advanced interactivity options. Learning how to integrate dynamic data, conditional visualization, and interactive controls enhances the adaptability and sophistication of dashboards. This expertise not only supports certification objectives but also equips professionals to deliver actionable insights in demanding workplace environments.
Mastery of charts, dashboards, and data visualization in Excel 2010 Expert transcends technical execution. It encompasses analytical reasoning, design sensibility, and strategic communication. Users who develop these competencies can transform raw data into compelling visual stories, provide real-time insights, and facilitate informed decision-making across diverse professional domains. The ability to craft intelligent, interactive, and visually coherent dashboards represents a pinnacle of Excel expertise, reflecting a seamless integration of analytical rigor and practical utility.
Strategies for Achieving Certification Mastery
Preparing for the 77-888 certification in Excel 2010 Expert requires a strategic and methodical approach that balances technical proficiency with analytical insight. The exam evaluates a candidate’s ability to utilize advanced Excel functions, manage large datasets, automate processes, and present data in a visually coherent manner. Effective preparation begins with a thorough understanding of the exam objectives, which encompass lookup functions, PivotTables, conditional analysis, macros, charts, dashboards, and data visualization. Mastery of these topics ensures that candidates can navigate the exam with confidence and demonstrate the analytical depth expected of Excel 2010 Expert professionals.
A structured study plan is fundamental for achieving certification success. Candidates should allocate sufficient time to practice each topic extensively, integrating both conceptual understanding and practical application. Hands-on exercises using real-world datasets help reinforce theoretical knowledge, allowing users to internalize the nuances of advanced Excel functionality. Engaging with sample exercises that simulate complex scenarios, such as financial reconciliation, inventory tracking, or performance analysis, develops the analytical agility required for the certification. Consistent practice across multiple data environments enhances familiarity with Excel tools and builds the confidence necessary to tackle challenging exam questions.
Mastering Advanced Functions
Advanced functions form the backbone of Excel 2010 Expert proficiency. Lookup mechanisms, including VLOOKUP, HLOOKUP, INDEX, and MATCH, allow users to retrieve and cross-reference information efficiently. Conditional logic functions, such as IF, AND, OR, and nested formulas, enable nuanced analysis based on specific criteria. Array formulas facilitate complex calculations across multiple datasets, while advanced data manipulation functions provide capabilities for aggregation, summarization, and dynamic reporting. Candidates should practice these functions extensively, combining them to create sophisticated analytical models that reflect real-world applications.
Integrating lookup and conditional functions is a particularly valuable skill for the exam. For instance, retrieving financial data based on multiple conditions or calculating performance metrics while dynamically adjusting criteria demonstrates both technical prowess and analytical judgment. Practicing multi-step formulas, nested operations, and array logic equips candidates to handle intricate problems efficiently and accurately, which is essential for achieving Excel 2010 Expert certification.
Leveraging PivotTables and Data Analysis
PivotTables remain a critical component of Excel 2010 Expert certification, offering dynamic summarization and analytical flexibility. Candidates must be adept at creating PivotTables, applying filters, grouping data, adding calculated fields, and extracting meaningful insights. Advanced practice includes multi-level nesting of fields, handling large datasets, and integrating PivotTables with lookup functions and macros to generate dynamic analytical models. Understanding the nuances of aggregation functions, sorting, and conditional filtering within PivotTables is essential for accurate and effective data analysis.
In addition to PivotTables, mastering advanced data analysis techniques such as scenario modeling, what-if analysis, and conditional aggregation strengthens problem-solving capabilities. Candidates should simulate real-world business scenarios, exploring multiple variables and potential outcomes to refine analytical reasoning. Practicing these techniques with authentic datasets builds familiarity with complex calculations and enhances confidence in applying solutions under exam conditions.
Developing Automation Skills with Macros
Automation is a defining feature of Excel 2010 Expert proficiency. Recording, editing, and executing macros allows candidates to streamline repetitive operations, automate complex workflows, and ensure consistency in analytical processes. Exam preparation should focus on identifying repetitive tasks, designing logical macro sequences, and integrating macros with other Excel functions such as PivotTables, lookup formulas, and conditional calculations. Advanced practice includes incorporating loops, conditional execution, and error handling within macros to create resilient and adaptable automation scripts.
Macros not only enhance efficiency but also minimize the risk of human error in high-stakes analytical environments. Candidates should practice developing automated reports, dashboards, and calculations, ensuring that scripts function accurately across diverse datasets. Mastery of automation is a key differentiator for Excel 2010 Expert certification, demonstrating both technical skill and operational acumen.
Crafting Effective Visualizations and Dashboards
Charts, dashboards, and data visualization are essential for conveying analytical insights effectively. Candidates should practice creating diverse chart types, including column, bar, line, pie, scatter, and combination charts, ensuring that each visualization aligns with the analytical objective. Dashboard design requires thoughtful arrangement of multiple charts, PivotTables, and data controls such as slicers and drop-down lists to create interactive and coherent interfaces. Advanced practice includes dynamic updates, conditional formatting, and integration with lookup functions to ensure that dashboards remain accurate and responsive as data changes.
Visualization skills extend beyond aesthetics, encompassing clarity, interpretive depth, and strategic communication. Excel 2010 Expert candidates should focus on presenting insights in a manner that facilitates informed decision-making, highlighting key trends, anomalies, and performance metrics. Effective dashboards allow users to explore data interactively, providing a comprehensive view of organizational performance while maintaining analytical precision.
Practice Techniques and Time Management
A crucial element of certification success is deliberate practice and efficient time management. Candidates should simulate exam conditions by completing timed exercises, ensuring familiarity with the types of questions, complexity, and pace required. Practice datasets should be varied, reflecting the multidimensional nature of real-world analytical tasks. Repetition builds both speed and accuracy, while review of errors provides insights into areas requiring improvement. Candidates should prioritize topics based on personal strengths and weaknesses, allocating additional time to complex functions, macros, and dashboards.
Regularly reviewing formulas, functions, and workflows enhances retention and reinforces procedural fluency. Candidates should maintain a practice journal, documenting common errors, solutions, and strategic insights gained during exercises. This reflective approach consolidates learning and fosters a disciplined mindset, which is invaluable for navigating the diverse challenges presented in the 77-888 exam.
Utilizing Resources and Professional Communities
Engaging with professional resources, tutorials, and online communities provides valuable support during exam preparation. These resources often include practice questions, case studies, and rare insights into complex Excel functionality. Collaborative learning and exposure to diverse problem-solving approaches enrich understanding, offering candidates innovative techniques and uncommon strategies for handling multifaceted datasets. Excel 2010 Expert certification candidates benefit from exploring a variety of perspectives, which enhances adaptability and analytical creativity.
Professional forums and user communities also provide guidance on best practices for macros, dashboards, PivotTables, and advanced formulas. Learning from experienced practitioners exposes candidates to advanced applications and subtle efficiencies that may not be covered in standard study materials. Integrating these insights into practice enhances readiness for both the certification exam and real-world professional challenges.
Maintaining Analytical Accuracy and Efficiency
Accuracy and efficiency are fundamental to both exam performance and professional competency. Candidates should develop systematic approaches to formula construction, data validation, and error handling to minimize mistakes. Techniques such as dynamic referencing, structured ranges, and careful documentation of workflows ensure that analyses remain transparent, reproducible, and reliable. Excel 2010 Expert users must balance speed with precision, producing analytical outputs that are both timely and accurate.
Efficiency also encompasses strategic use of Excel features to streamline operations. For instance, combining lookup functions with macros or integrating PivotTables with dashboards reduces redundant effort and accelerates analytical workflows. Candidates should practice constructing integrated models that combine multiple features, reflecting the interconnected nature of advanced Excel functionality and demonstrating preparedness for the certification exam.
Cultivating Exam Readiness
Exam readiness involves both technical preparation and psychological preparedness. Candidates should approach study with a disciplined schedule, systematically covering all exam objectives while reinforcing weak areas. Simulated exams and timed exercises develop familiarity with exam structure and pacing, reducing anxiety and improving focus. Additionally, understanding the practical applications of each function, from lookup formulas to data visualization, fosters confidence and enables candidates to approach problems strategically.
Attention to detail, logical reasoning, and analytical judgment are as important as technical skill in achieving certification success. Candidates should focus on interpreting data accurately, applying functions effectively, and producing outputs that reflect professional standards. Cultivating these competencies ensures that candidates are not only prepared for the exam but also capable of applying their expertise in real-world contexts.
Continuous Learning and Professional Growth
Achieving Excel 2010 Expert certification is a milestone, but continuous learning is essential to maintain proficiency and adapt to evolving analytical challenges. Professionals should continue practicing advanced functions, exploring new Excel features, and integrating emerging techniques into their workflows. Engaging with case studies, attending workshops, and collaborating with peers reinforces expertise and encourages innovation. The skills developed through rigorous preparation for the 77-888 exam provide a foundation for ongoing professional growth, enabling users to tackle increasingly complex analytical challenges with confidence.
Mastery of advanced Excel functions, macros, dashboards, and data visualization transforms candidates into versatile analysts capable of managing, interpreting, and presenting complex datasets. This combination of technical knowledge, analytical judgment, and practical application is highly valued across industries, reflecting the enduring relevance of Excel 2010 Expert proficiency.
Conclusion
Preparing for the 77-888 certification in Excel 2010 Expert requires dedication, strategic planning, and consistent practice. By mastering advanced functions, PivotTables, macros, and visualization techniques, candidates develop the analytical rigor and technical agility necessary for certification and professional excellence. Integrating these capabilities with disciplined study habits, deliberate practice, and engagement with professional resources ensures readiness for both the exam and real-world applications. Excel 2010 Expert certification represents not only technical mastery but also the ability to transform complex data into actionable insights, equipping professionals to make informed decisions and contribute meaningfully to organizational success.