Exam Code: Looker Business Analyst
Exam Name: Looker Business Analyst
Certification Provider: Google
Corresponding Certification: Looker Business Analyst
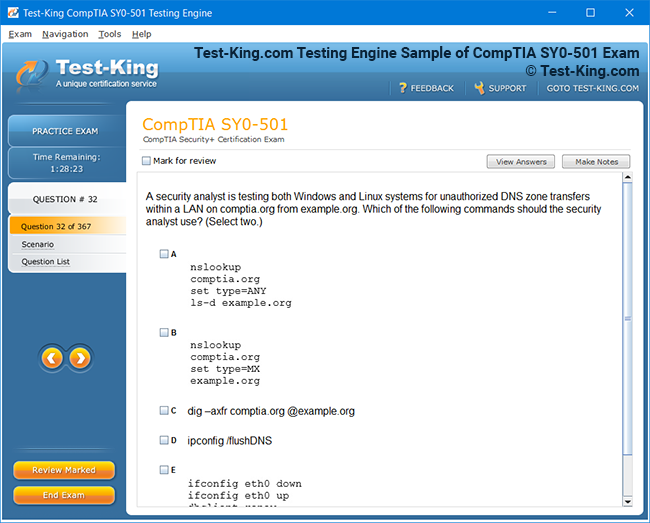
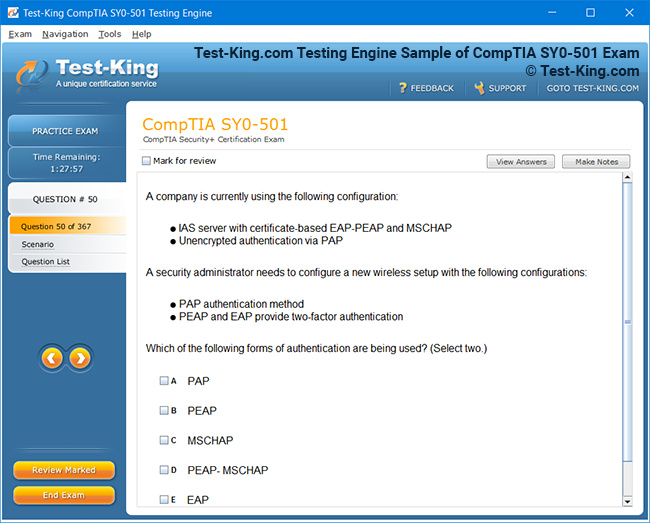
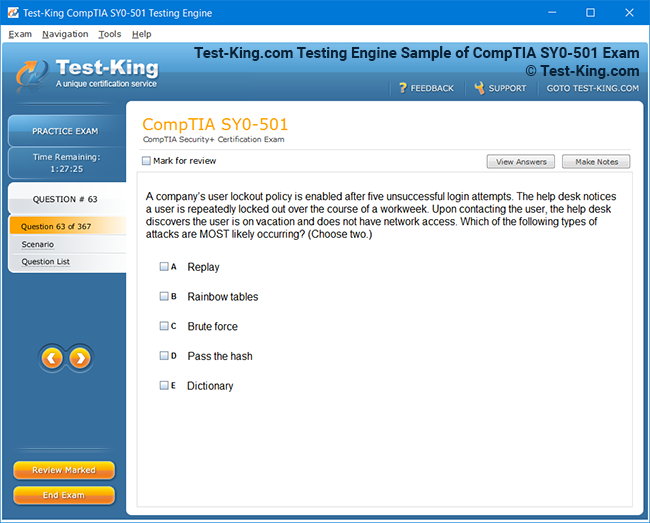
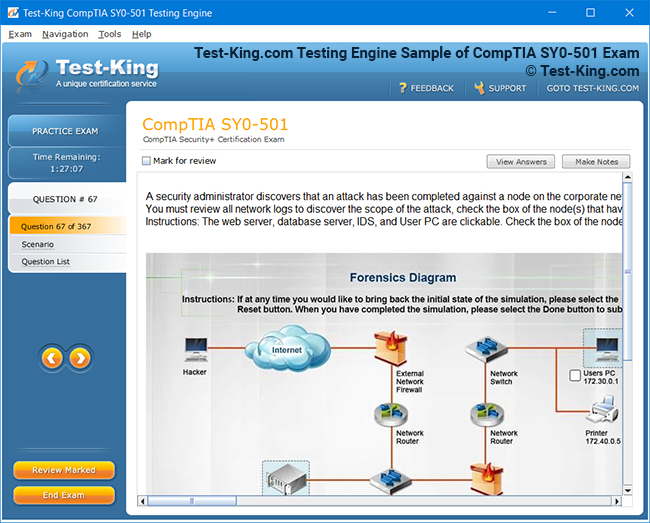
Product Screenshots

Frequently Asked Questions
How can I get the products after purchase?
All products are available for download immediately from your Member's Area. Once you have made the payment, you will be transferred to Member's Area where you can login and download the products you have purchased to your computer.
How long can I use my product? Will it be valid forever?
Test-King products have a validity of 90 days from the date of purchase. This means that any updates to the products, including but not limited to new questions, or updates and changes by our editing team, will be automatically downloaded on to computer to make sure that you get latest exam prep materials during those 90 days.
Can I renew my product if when it's expired?
Yes, when the 90 days of your product validity are over, you have the option of renewing your expired products with a 30% discount. This can be done in your Member's Area.
Please note that you will not be able to use the product after it has expired if you don't renew it.
How often are the questions updated?
We always try to provide the latest pool of questions, Updates in the questions depend on the changes in actual pool of questions by different vendors. As soon as we know about the change in the exam question pool we try our best to update the products as fast as possible.
How many computers I can download Test-King software on?
You can download the Test-King products on the maximum number of 2 (two) computers or devices. If you need to use the software on more than two machines, you can purchase this option separately. Please email support@test-king.com if you need to use more than 5 (five) computers.
What is a PDF Version?
PDF Version is a pdf document of Questions & Answers product. The document file has standart .pdf format, which can be easily read by any pdf reader application like Adobe Acrobat Reader, Foxit Reader, OpenOffice, Google Docs and many others.
Can I purchase PDF Version without the Testing Engine?
PDF Version cannot be purchased separately. It is only available as an add-on to main Question & Answer Testing Engine product.
What operating systems are supported by your Testing Engine software?
Our testing engine is supported by Windows. Andriod and IOS software is currently under development.
Top Google Exams
- Professional Cloud Architect - Google Cloud Certified - Professional Cloud Architect
- Generative AI Leader
- Professional Machine Learning Engineer
- Associate Cloud Engineer
- Professional Data Engineer - Professional Data Engineer on Google Cloud Platform
- Cloud Digital Leader
- Professional Security Operations Engineer
- Professional Cloud DevOps Engineer
- Professional Cloud Network Engineer
- Professional Cloud Security Engineer
- Associate Google Workspace Administrator
- Professional Cloud Developer
- Professional Cloud Database Engineer
- Associate Data Practitioner - Google Cloud Certified - Associate Data Practitioner
- Professional ChromeOS Administrator
- Professional Google Workspace Administrator
Understanding Google Looker Business Analyst and Its Significance
Business intelligence has evolved tremendously over the last few decades, transforming from rudimentary reporting tools to sophisticated platforms capable of analyzing vast and complex datasets. Initially, businesses relied on static reports generated from spreadsheets and basic databases to make operational decisions. These reports often required significant manual intervention and were limited in scope, providing only a narrow view of organizational performance. As enterprises began to accumulate vast amounts of structured and unstructured data from multiple sources, the need for advanced analytics became apparent.
The term business intelligence encompasses the processes, tools, and methodologies that transform raw data into actionable insights. These insights are essential for both tactical and strategic decision-making within an organization. By interpreting patterns, anomalies, and trends in data, organizations can anticipate market shifts, optimize operations, and enhance overall performance. The evolution of technology has been a key catalyst in this transformation, enabling businesses to harness enormous volumes of information from diverse sources including SQL databases, cloud-based storage solutions, and document-based repositories like MongoDB.
Over time, business intelligence has expanded from merely reporting historical data to encompassing predictive analytics and real-time decision-making. Early BI tools focused primarily on summarizing past events, often using static charts and tables. Modern platforms, however, provide interactive dashboards, dynamic visualizations, and predictive models that allow businesses to forecast future outcomes. This shift has enabled organizations to move from reactive decision-making to proactive strategies, ensuring that they remain competitive in rapidly changing markets.
The Role of Data in Decision-Making
At the core of business intelligence lies data. Data is the raw material from which insights are derived, and the quality and diversity of data directly influence the accuracy of the conclusions drawn. Organizations today generate data at an unprecedented pace from transactional systems, customer interactions, social media engagement, and Internet of Things devices. Without proper tools to interpret this information, vast quantities of valuable data remain dormant and underutilized.
Business intelligence platforms serve as the conduit between raw data and informed decisions. They provide organizations with the ability to aggregate, clean, and analyze data, converting it into a coherent narrative that supports managerial and executive decisions. By consolidating information from multiple sources, businesses can create a comprehensive view of operations, customers, and market trends. This enables leaders to identify opportunities for growth, optimize supply chains, and tailor products or services to meet evolving customer demands.
One of the most profound benefits of data-driven decision-making is the reduction of uncertainty. Decisions made solely on intuition or fragmented information carry inherent risks. By leveraging analytics, organizations can base their choices on empirical evidence, minimizing the potential for costly errors. Furthermore, data insights help identify inefficiencies and redundancies within processes, allowing organizations to streamline operations and maximize productivity.
Key Features of Modern Business Intelligence Tools
Modern business intelligence tools provide a wide array of functionalities that facilitate data analysis and interpretation. These tools go beyond traditional reporting by offering interactive dashboards, visualizations, and analytical models that are tailored to meet the specific needs of various stakeholders within an organization.
Among the most widely used tools are platforms such as Tableau, which provides highly interactive and visually compelling dashboards that allow users to explore data intuitively. Power BI integrates seamlessly with existing enterprise systems, enabling organizations to consolidate data from disparate sources into a unified analytical framework. QlikView emphasizes associative data modeling, allowing users to explore relationships within data that might not be immediately apparent through conventional queries. Google Data Studio provides a cloud-based approach, facilitating collaboration and real-time reporting for distributed teams. Other platforms, including SSRS, Metabase, and QuickSight, offer specialized functionalities ranging from structured reporting to advanced analytics, catering to organizations of varying sizes and complexity.
These tools share common attributes that define modern business intelligence: the ability to access and integrate multiple data sources, provide real-time or near-real-time insights, support interactive visualizations, and enable self-service analytics for business users. The convergence of these capabilities allows organizations to make decisions quickly, efficiently, and with a high degree of confidence.
The Transformative Power of Analytics
Analytics lies at the heart of business intelligence, transforming static data into a dynamic resource that drives action. Through analytical techniques, businesses can uncover hidden patterns, correlations, and trends that inform strategic decisions. This involves applying statistical methods, predictive models, and machine learning algorithms to data, allowing organizations to anticipate future outcomes and prepare accordingly.
For instance, retailers can use analytics to predict customer buying behavior, optimize inventory levels, and design personalized marketing campaigns. Financial institutions can identify potential fraud by analyzing transaction patterns, while healthcare providers can improve patient outcomes through predictive models that highlight risk factors and treatment efficacy. The versatility of analytics demonstrates its critical role in shaping operational strategies and long-term business planning.
A notable aspect of modern analytics is its ability to provide insights at both a macro and micro level. Executives may rely on high-level dashboards that summarize organizational performance, while departmental managers may explore granular details related to specific processes or customer segments. This dual perspective ensures that decision-making is both informed and contextually relevant, fostering alignment across all levels of the organization.
Self-Service Analytics and Empowering Users
One of the most significant trends in business intelligence is the rise of self-service analytics. Traditional BI often required specialized technical skills, limiting the accessibility of insights to a small group of analysts or IT professionals. Self-service platforms democratize access to data, allowing business users to explore, visualize, and interpret information without relying on technical intermediaries.
Self-service analytics enhances agility by enabling teams to respond rapidly to emerging trends and operational challenges. Users can generate ad-hoc reports, test hypotheses, and visualize scenarios in real-time, providing immediate feedback that supports decision-making. This empowerment fosters a culture of data-driven thinking, encouraging individuals at all levels to rely on empirical evidence rather than intuition or anecdotal information.
By providing intuitive interfaces, guided workflows, and interactive visualizations, self-service BI platforms reduce the dependency on complex technical procedures. This not only accelerates insight generation but also improves organizational efficiency, as teams can focus on strategic initiatives rather than data wrangling or report creation.
Integrating Data from Multiple Sources
In today’s complex business environment, data resides in multiple formats and locations. It can be found in structured SQL databases, unstructured document stores, cloud-based storage, APIs, and legacy systems. Effective business intelligence requires seamless integration of these disparate sources to create a unified view of organizational operations.
Data integration involves consolidating information from different repositories, transforming it into a standardized format, and ensuring its accuracy and consistency. Modern BI tools provide connectors and interfaces that facilitate this process, enabling organizations to extract meaningful insights from a heterogeneous data landscape. For example, combining sales data from a relational database with customer engagement metrics from a cloud CRM system can reveal nuanced insights into customer behavior and purchasing trends.
The ability to harmonize data from multiple sources also enhances predictive analytics and machine learning applications. By providing a comprehensive dataset, organizations can build models that account for a wider range of variables, improving accuracy and reliability. This holistic approach ensures that insights reflect the complexity of real-world operations and support more informed decision-making.
Metrics and Performance Evaluation
Performance evaluation is a core component of business intelligence. Organizations rely on key performance indicators, benchmarks, and metrics to assess the effectiveness of their strategies and operations. Modern BI platforms provide tools for monitoring, tracking, and visualizing these metrics, enabling managers to identify deviations, uncover inefficiencies, and make course corrections.
Metrics can range from financial indicators such as revenue, profit margins, and cost per acquisition, to operational measures like production throughput, defect rates, and service response times. By linking these metrics to strategic objectives, organizations create a framework for continuous improvement, aligning day-to-day activities with long-term goals.
Visualization plays a crucial role in performance evaluation, translating numerical data into intuitive representations that facilitate comprehension and decision-making. Dashboards, charts, and graphs allow users to quickly grasp trends, compare performance across periods or departments, and identify anomalies that require attention. This visual approach enhances cognitive processing, enabling faster and more accurate assessments.
The Competitive Advantage of Data-Driven Organizations
Organizations that embrace business intelligence gain a distinct competitive advantage. Data-driven enterprises are better positioned to anticipate market shifts, respond to customer needs, and optimize internal operations. By leveraging analytics and insights, these organizations can make strategic decisions with greater confidence and precision.
The competitive edge is particularly evident in industries with high volatility or rapid innovation cycles. For example, e-commerce companies use BI to analyze consumer behavior, optimize pricing strategies, and streamline logistics, allowing them to outperform competitors who rely on intuition or outdated reporting methods. Similarly, financial institutions leverage predictive analytics to identify emerging risks and opportunities, enabling proactive management that safeguards profitability and reputation.
Data-driven decision-making also fosters innovation by highlighting unmet needs, inefficiencies, or emerging trends. Organizations can experiment with new products, services, or processes based on insights derived from comprehensive data analysis. This iterative approach allows businesses to adapt quickly, refine strategies, and maintain relevance in dynamic markets.
Future Perspectives of Business Intelligence
The future of business intelligence lies in deeper integration of artificial intelligence, machine learning, and natural language processing. These technologies promise to enhance predictive capabilities, automate routine analysis, and provide more intuitive ways to interact with data. Advanced algorithms can uncover hidden relationships, detect anomalies, and generate recommendations, further amplifying the value of business intelligence.
As the volume, velocity, and variety of data continue to grow, organizations will increasingly rely on BI platforms that can manage complex datasets and provide real-time insights. The convergence of cloud computing, big data, and advanced analytics will enable organizations to operate with unprecedented agility and precision, reshaping competitive landscapes across industries.
The emphasis will shift from merely reporting historical performance to actively predicting outcomes and prescribing actions. Organizations that harness these capabilities will not only survive but thrive in an environment characterized by rapid technological advancement and evolving customer expectations.
The Emergence of Looker in Business Intelligence
As organizations navigate the ever-expanding landscape of data, the need for a platform that can unify diverse sources, deliver actionable insights, and provide intuitive analytics has never been more pressing. Looker has emerged as a quintessential solution, bridging the gap between raw data and strategic decision-making. Unlike conventional reporting tools, Looker embodies a modern paradigm in business intelligence, enabling organizations to interact with data dynamically, explore trends, and derive predictive insights with minimal latency.
Looker’s prominence in the analytics domain is amplified by its acquisition by a global technology leader, which has catalyzed its integration with cloud-based ecosystems and reinforced its capabilities as a versatile platform. Organizations leveraging Looker benefit from a seamless synthesis of data from transactional systems, cloud warehouses, relational databases, and emerging data repositories. This amalgamation ensures that insights are comprehensive, current, and contextually relevant, which is indispensable in today’s hyper-competitive markets.
Integration with Diverse Data Sources
The ability to integrate multiple and varied data sources is central to Looker’s functionality. Enterprises often operate across numerous platforms, each generating voluminous data streams. Looker accommodates this complexity by connecting to traditional relational databases such as MySQL and MSSQL, cloud-native warehouses including Google BigQuery and Amazon Redshift, and hybrid storage environments that combine on-premise and cloud infrastructures. This connectivity permits organizations to consolidate fragmented data landscapes into a coherent analytical framework, allowing decision-makers to visualize and interpret holistic trends.
Furthermore, Looker’s architecture eliminates the need for repetitive data extraction or duplication, instead enabling direct querying within source systems. This in-database querying approach ensures that analytics are conducted on live data, providing real-time intelligence without the overhead of ETL processes. As a result, businesses can maintain data fidelity, reduce latency, and ensure that their analytical narratives reflect the most current operational realities.
Dashboarding and Visualization Capabilities
One of Looker’s most compelling attributes lies in its dashboarding and visualization capabilities. Dashboards are no longer static representations of historical data but interactive canvases that allow users to explore information intuitively. Users can manipulate filters, drill into underlying details, and combine multiple data streams to uncover latent patterns. The visualizations range from conventional charts and graphs to sophisticated heatmaps and trend analyses, accommodating varied analytical requirements across departments.
These visual tools serve as conduits between complex datasets and human cognition, translating numerical abstractions into comprehensible insights. Managers, executives, and analysts can interpret these visualizations rapidly, facilitating informed decision-making. By transforming raw data into an immediately intelligible narrative, Looker enhances operational responsiveness and strategic foresight.
LookML: The Language of Modern Analytics
Central to Looker’s innovation is LookML, a declarative modeling language designed to define data relationships and business logic. LookML allows developers to construct modular, reusable models that capture the intricacies of organizational data while remaining comprehensible to business users. By separating data modeling from visualization, Looker ensures that analytical integrity is maintained even as dashboards evolve or users explore data ad hoc.
LookML provides constructs for defining dimensions, measures, aggregations, and derived tables, enabling developers to codify complex analytical relationships with precision. These definitions allow consistent interpretation of metrics across the organization, mitigating the risk of contradictory reports or misaligned KPIs. Additionally, LookML supports version control and collaborative development, ensuring that multiple contributors can enhance models concurrently without jeopardizing production analytics.
Security and Data Governance
Data security and governance are fundamental in contemporary business intelligence environments, and Looker addresses these requirements comprehensively. Organizations can implement row-level and field-level access controls, ensuring that sensitive information is accessible only to authorized personnel. This granularity allows executives, analysts, and operational staff to access the data necessary for their functions while maintaining compliance with regulatory standards.
Governance mechanisms within Looker extend to versioning, audit trails, and model approvals. Every change to the analytical models or dashboards is subject to oversight, ensuring that organizational standards are upheld and analytical consistency is preserved. This governance framework fosters confidence in the insights produced and reduces the likelihood of errors stemming from uncoordinated modifications.
Self-Service Analytics and Organizational Empowerment
Looker embodies a self-service paradigm that empowers users to interrogate data independently. This democratization of analytics reduces reliance on technical intermediaries, enabling teams to formulate hypotheses, visualize scenarios, and test assumptions in real-time. By providing intuitive interfaces and guided exploration, Looker ensures that non-technical users can engage meaningfully with complex datasets.
The implications of self-service analytics are profound. Organizations can respond to emergent trends swiftly, iterate on strategies based on immediate feedback, and cultivate a culture where decisions are grounded in empirical evidence. By removing bottlenecks associated with traditional reporting processes, Looker accelerates insight generation and operational agility, allowing organizations to seize opportunities and mitigate risks with greater precision.
Data Modeling and Exploration
Exploration within Looker is facilitated through a sophisticated modeling framework that allows users to traverse data relationships seamlessly. Developers can define models that join multiple tables, specify hierarchies, and calculate derived metrics. Users, in turn, can explore these models interactively, filtering, aggregating, and segmenting data to answer specific business questions.
This exploration capability transforms analytical practice from static querying into an iterative and investigative process. Users are no longer constrained by pre-defined reports; they can probe datasets dynamically, uncovering trends, correlations, and anomalies that may otherwise remain obscured. The combination of robust modeling and flexible exploration positions Looker as a tool that both preserves analytical rigor and encourages investigative curiosity.
Collaborative Development and Version Control
In large organizations, multiple analysts and developers often collaborate on shared projects. Looker’s architecture supports this by integrating version control and approval workflows. Changes to models, dimensions, or measures can be proposed, reviewed, and approved before being deployed, ensuring analytical consistency and reducing the risk of inadvertent errors.
This collaborative environment allows distributed teams to contribute to the evolution of analytics without interfering with production operations. Developers can experiment with enhancements, test new calculations, and refine dashboards while preserving the integrity of live reports. Version control not only safeguards data models but also provides a historical record of modifications, enabling accountability and traceability across complex projects.
Centralized Analytics and Single Source of Truth
A fundamental principle in Looker’s design is the establishment of a single source of truth. By centralizing data and standardizing models, organizations can ensure that all stakeholders reference the same definitions, metrics, and assumptions. This reduces the risk of conflicting interpretations and fosters coherence in decision-making.
Centralized analytics also simplifies reporting and regulatory compliance, as organizations can demonstrate consistency in how data is processed, analyzed, and presented. The single source of truth principle encourages organizational alignment, ensuring that decisions at every level are informed by a unified understanding of operational realities.
Real-Time and Near Real-Time Insights
In contemporary markets, the speed of insight generation can determine competitive advantage. Looker’s architecture supports real-time and near real-time analytics, enabling organizations to monitor performance, detect anomalies, and respond to operational developments as they occur.
By querying live data sources and minimizing reliance on intermediate extraction or replication processes, Looker reduces latency and ensures that decision-makers have access to current information. This capability is particularly valuable in environments where rapid adaptation is necessary, such as e-commerce, finance, logistics, and healthcare. Timely insights enable proactive interventions, risk mitigation, and the capitalization of emerging opportunities.
Advanced Analytics and Predictive Capabilities
Beyond descriptive analytics, Looker facilitates advanced analytical techniques, including predictive modeling and trend analysis. By leveraging historical data and sophisticated algorithms, organizations can forecast future outcomes, anticipate risks, and identify strategic opportunities. These predictive capabilities enhance planning, resource allocation, and operational efficiency.
For example, supply chain managers can predict demand fluctuations and adjust inventory accordingly, marketers can identify emerging customer preferences, and financial analysts can forecast revenue trends or potential liabilities. The integration of predictive analytics within the BI framework allows organizations to move from reactive reporting to proactive strategy formulation.
Customization and Scalability
Looker is inherently adaptable, allowing organizations to tailor dashboards, models, and analytical workflows to their specific needs. Custom measures, calculated fields, and specialized visualizations can be designed to accommodate unique business requirements, ensuring that insights are both relevant and actionable.
Scalability is another defining characteristic. Whether an organization operates with tens of users or tens of thousands, Looker can accommodate growth without compromising performance. Its cloud-compatible architecture, efficient querying, and modular design enable expansion across geographies, departments, and functional areas while maintaining a consistent analytical framework.
Enhancing Decision-Making Across Departments
Looker’s utility extends to various departments within an enterprise. Executives benefit from high-level dashboards that consolidate performance metrics across divisions. Sales and marketing teams gain visibility into customer behaviors, campaign effectiveness, and revenue trends. Operations can monitor workflows, production efficiency, and service delivery, while finance teams analyze profitability, expenditures, and risk exposure.
By providing relevant insights tailored to the responsibilities of each department, Looker ensures that decisions are informed, precise, and aligned with organizational objectives. This cross-functional analytical capability enhances coherence in strategy execution and promotes data-driven collaboration.
The Role of Automation in Analytics
Automation is integral to Looker’s value proposition. Routine calculations, report generation, and data refreshes can be scheduled and executed automatically, reducing the burden on analysts and ensuring consistency in outputs. Automated alerts can notify users of deviations from expected patterns, enabling timely intervention and minimizing the impact of potential issues.
By embedding automation into analytical workflows, organizations free human resources to focus on interpretation, strategic evaluation, and scenario planning. This balance between automation and human insight enhances efficiency while preserving analytical depth and flexibility.
In-Database Architecture and Its Advantages
Looker’s in-database architecture distinguishes it from traditional business intelligence tools that often require data extraction, replication, or transformation into separate storage systems for analysis. By querying data directly in its source environment, Looker maintains fidelity and consistency while reducing latency in analytical outputs. This approach eliminates redundancy, minimizes storage overhead, and ensures that insights reflect the most current operational realities.
Organizations benefit from this architecture as it allows them to access voluminous datasets without the performance penalties associated with moving or duplicating information. Analytics occur where the data resides, whether in relational databases, cloud warehouses, or hybrid storage environments. This capability is particularly valuable for enterprises handling large-scale transactions, real-time customer interactions, or dynamic operational workflows. By leveraging in-database querying, businesses can maintain agility while preserving the integrity of their analytical processes.
LookML: Defining Dimensions and Measures
Central to Looker’s versatility is LookML, a modeling language that allows developers to define dimensions, measures, and derived metrics. Dimensions represent categorical data such as customer segments, product types, or geographical regions, while measures capture quantitative aggregations like revenue, counts, or averages. LookML provides the scaffolding for these definitions, ensuring consistency across all dashboards, reports, and analytical explorations.
Developers can construct complex relationships between tables, join multiple views, and generate reusable models that adhere to business rules. Derived metrics, such as calculated fields or aggregations, are codified once and utilized across multiple analyses, ensuring uniformity in interpretations. The modularity of LookML enhances maintainability, reduces the potential for error, and allows organizations to scale analytics without sacrificing rigor.
Creating Explores for Interactive Analysis
Explores in Looker provide a dynamic interface for users to interact with data. By linking multiple tables or views, explores allow users to traverse relationships, filter data, and uncover patterns without requiring technical expertise in querying. These interactive environments transform static datasets into exploratory canvases, empowering business users to investigate questions, identify trends, and test hypotheses in real time.
The flexibility of explores ensures that analysts can combine diverse metrics, segment data by multiple dimensions, and visualize outcomes in formats most relevant to their decision-making context. As a result, organizations gain insights that are both granular and strategic, supporting operational optimization and forward-looking planning.
Row-Level and Field-Level Security
Maintaining security while providing analytical access is a critical consideration for modern organizations. Looker addresses this by allowing fine-grained controls over both rows and fields. Row-level security ensures that users can only access data relevant to their operational purview, such as regional sales teams viewing only local transactions. Field-level security restricts sensitive information, such as salaries or personally identifiable data, from unauthorized users while still permitting broader access to aggregate metrics.
These security measures are essential for compliance with regulatory frameworks, protecting confidential information, and ensuring that analytical outputs are trustworthy. By embedding security within the modeling layer, Looker allows organizations to balance accessibility with governance seamlessly.
Derived Tables and Symmetric Aggregation
Advanced analytics often require the generation of temporary or derived datasets. Looker supports derived tables, which enable developers to pre-calculate complex aggregations, perform transformations, or generate intermediate results that streamline downstream analysis. Derived tables enhance performance by reducing the computational load during interactive exploration and ensure consistent calculations across multiple reports.
Symmetric aggregation further extends Looker’s analytical capabilities, allowing metrics to be aggregated consistently across various hierarchies and levels of granularity. This ensures that totals, subtotals, and averages maintain coherence regardless of the dimensional perspective applied, which is crucial for accurate reporting and decision-making.
Caching and Performance Optimization
Looker incorporates caching mechanisms to enhance performance and reduce query load on underlying databases. Frequently accessed data or recurring queries are cached, enabling faster retrieval for users without compromising data accuracy. This feature is particularly beneficial in high-traffic analytical environments, where multiple users may access similar metrics simultaneously.
Caching optimizes response times for dashboards and reports, ensuring that decision-makers receive timely insights without overburdening source systems. By balancing real-time querying with intelligent caching, Looker achieves both agility and efficiency, providing a seamless analytical experience for users.
Collaborative Development and Project Management
In enterprise environments, multiple developers often collaborate on the same analytics project. Looker’s framework supports collaborative development by integrating version control, approval workflows, and environment management. Developers can propose changes to models, dashboards, or calculations, which are then reviewed and approved before deployment. This safeguards production analytics while enabling iterative enhancements and experimentation.
The collaborative approach encourages knowledge sharing, promotes consistency, and allows teams to manage complex projects with multiple contributors. Versioning ensures accountability, traceability, and the ability to revert to previous states if required, which is essential for maintaining analytical integrity across evolving datasets and organizational needs.
Single Source of Truth and Centralized Data
A single source of truth is a foundational principle in Looker’s design. By centralizing models, dimensions, measures, and data definitions, organizations can ensure that all users access consistent and validated information. This reduces discrepancies, eliminates conflicting interpretations, and fosters alignment across departments.
Centralized data management also streamlines reporting, auditing, and regulatory compliance. When all analytical outputs derive from the same trusted definitions, organizations can confidently base decisions on empirical evidence rather than fragmented or inconsistent datasets. This coherence strengthens operational governance and strategic decision-making.
Real-Time Data Exploration and Insight Generation
The immediacy of insight is a competitive differentiator in contemporary business environments. Looker enables real-time or near-real-time analysis by querying data in place, minimizing delays inherent in traditional extraction or replication methods. Users can monitor key performance indicators, detect anomalies, and respond proactively to emerging trends.
Real-time exploration allows teams to identify issues or opportunities as they occur, rather than retrospectively analyzing historical data. This capability is particularly relevant in sectors such as retail, finance, and logistics, where rapid response can influence profitability, customer satisfaction, and operational efficiency.
Custom Dimensions, Measures, and Calculated Fields
Organizations often require metrics that are specific to their operational context. Looker allows developers to create custom dimensions, measures, and calculated fields, ensuring that analytics reflect unique business needs. Custom dimensions may include categorizing products by strategic attributes, segmenting customers based on behavioral characteristics, or tracking operational processes by bespoke parameters.
Calculated measures enable complex aggregations, ratios, or performance indicators to be codified once and applied consistently across multiple analyses. This functionality enhances analytical precision, ensures uniform interpretation, and supports nuanced decision-making.
Embedded Analytics and Integration Capabilities
Looker’s embedded analytics extend insights beyond the internal organization, allowing integration with third-party applications, portals, and operational systems. This enables stakeholders, partners, or customers to access tailored analytics within their existing workflows, enhancing collaboration and operational transparency.
Integration capabilities also extend to automated workflows, alerts, and notifications. Organizations can trigger actions based on analytical thresholds, ensuring that insights translate directly into operational decisions and responses. The ability to embed analytics seamlessly enhances value delivery and reinforces the role of data as an actionable asset.
Scaling Analytics Across Organizations
Enterprises often require analytics platforms that can scale both in terms of users and data volume. Looker’s architecture accommodates growth without compromising performance or analytical rigor. Whether the organization operates across multiple geographies, divisions, or functional areas, Looker can maintain consistent data models, dashboards, and metrics.
Scalability also extends to user empowerment. Self-service capabilities ensure that as analytical demands increase, business users can explore data independently without overwhelming IT or data teams. This scalability ensures that insights remain accessible, timely, and actionable, even as organizational complexity grows.
Enhancing Decision-Making Across Functions
Looker’s capabilities support decision-making across all functional areas of an enterprise. Marketing and sales teams can track campaign performance, identify emerging customer trends, and optimize revenue generation. Operations teams gain visibility into process efficiency, resource utilization, and service delivery metrics. Finance teams can monitor expenditures, forecast cash flow, and assess risk exposure.
By tailoring dashboards and models to the needs of each function, Looker ensures that analytical outputs are relevant, actionable, and aligned with organizational priorities. This cross-functional analytical coherence enhances coordination, strategy execution, and operational effectiveness.
Predictive Analytics and Forward-Looking Insights
Beyond descriptive reporting, Looker supports predictive analytics that anticipate future outcomes based on historical trends and behavioral patterns. Predictive models can estimate demand fluctuations, forecast revenue streams, or identify potential operational risks. This forward-looking capability allows organizations to move from reactive decision-making to proactive strategy formulation.
Predictive insights enhance resource allocation, planning, and risk mitigation, providing a significant competitive advantage in rapidly changing markets. By combining historical data, real-time analytics, and predictive modeling, organizations can develop strategies that are both evidence-based and anticipatory.
Automation of Reporting and Analytical Workflows
Automation is an integral component of Looker’s functionality. Routine tasks such as report generation, metric calculation, and data refreshes can be scheduled and executed automatically. Alerts and notifications can be configured to highlight deviations from expected patterns or thresholds.
By automating repetitive processes, organizations reduce human error, improve consistency, and free analysts to focus on interpretation, scenario planning, and strategic evaluation. Automation also accelerates insight delivery, ensuring that decision-makers have timely and reliable information to guide operational and strategic initiatives.
Collaborative Governance and Auditability
Looker provides robust mechanisms for governance, collaboration, and auditability. Every change to models, dashboards, or calculations is tracked, reviewed, and approved before deployment. This ensures that analytical integrity is maintained, inconsistencies are minimized, and accountability is preserved.
Audit trails provide transparency into who modified a model or dashboard and when, enabling organizations to comply with internal policies and external regulatory requirements. Governance frameworks within Looker combine oversight with flexibility, ensuring that analytics remain both accurate and adaptable.
The Role of Looker Developers in Modern Analytics
Looker developers occupy a pivotal role within organizations, bridging the divide between complex datasets and actionable insights. They translate raw information into models, dashboards, and visualizations that enable decision-makers to navigate organizational performance with clarity. Unlike conventional analysts who may primarily interpret data, Looker developers architect the framework upon which analytical exploration occurs. This involves defining dimensions, measures, joins, aggregations, and derived calculations in a manner that ensures consistency, accuracy, and accessibility for business users.
Organizations increasingly rely on Looker developers to create reusable models, streamline reporting processes, and enable self-service analytics. Their work supports cross-functional departments by providing structured data interpretations, facilitating operational efficiency, and enabling strategic foresight. The role demands not only technical acumen but also an understanding of business priorities and the ability to translate abstract datasets into coherent, actionable intelligence.
Mastering LookML for Analytical Rigor
A cornerstone of Looker development is mastery of LookML, the proprietary modeling language that defines how data is structured, aggregated, and explored. LookML allows developers to construct a coherent architecture that supports consistent interpretation across dashboards, reports, and analytical inquiries. By defining reusable views, dimensions, measures, and derived tables, LookML ensures that analytical outputs are both reliable and adaptable to evolving organizational needs.
Proficiency in LookML requires understanding its modular approach, which separates logic from visualization. Developers define the relationships between datasets, encode business rules, and configure metrics centrally, enabling business users to explore data without compromising analytical integrity. LookML also supports complex calculations, symmetric aggregations, and caching mechanisms, enhancing both performance and usability.
The language’s declarative nature ensures clarity, maintainability, and scalability. By creating models that capture the intricacies of organizational data, developers can facilitate sophisticated analysis while maintaining a single source of truth, reducing inconsistencies and promoting coherence across all analytical outputs.
SQL Expertise and Data Manipulation
Looker development is intrinsically tied to SQL, the lingua franca of relational databases. Developers must be adept at crafting queries that retrieve, join, aggregate, and filter data efficiently. SQL expertise allows Looker developers to optimize model performance, define derived tables, and ensure that interactive dashboards respond rapidly to user queries.
Advanced SQL concepts, including subqueries, conditional expressions, grouping, partitioning, and window functions, are essential. These techniques enable developers to perform intricate calculations, generate meaningful metrics, and handle complex business logic within LookML models. Understanding database optimization, indexing, and query execution plans further empowers developers to manage performance, particularly in high-volume, real-time analytical environments.
A nuanced grasp of SQL also facilitates the integration of Looker with various data sources, from cloud-native warehouses to on-premise relational databases. Developers can navigate differences in syntax, data types, and storage structures, ensuring that analytics are consistent, accurate, and adaptable to heterogeneous environments.
Data Modeling Concepts and Practices
Effective data modeling is fundamental to Looker development. Developers must understand the principles of dimensional modeling, including the distinction between facts and dimensions, hierarchies, granularities, and type casting. Accurate modeling ensures that metrics, aggregations, and reports reflect the true state of organizational operations.
Developers design models that support exploratory analysis while minimizing redundancy and preserving data integrity. They consider relationships between datasets, normalization versus denormalization, and the trade-offs between storage efficiency and query performance. By structuring data logically and intuitively, Looker developers enable business users to navigate complex datasets without requiring deep technical expertise.
Understanding modeling practices also facilitates collaboration. When models are well-structured, multiple developers can contribute simultaneously, enhancing scalability and ensuring that analytical frameworks evolve cohesively as organizational needs change.
Version Control and Collaborative Workflows
In enterprise environments, multiple developers often work on the same Looker project. Effective collaboration requires structured version control and clear workflows to prevent conflicts, maintain consistency, and ensure production stability. Looker integrates with Git-based repositories, enabling developers to track changes, review contributions, and approve modifications before deployment.
Version control allows teams to manage concurrent development, experiment with new models or calculations, and roll back changes if necessary. It also provides a historical record of modifications, enhancing accountability and auditability. Collaborative workflows ensure that enhancements, corrections, and optimizations are systematically validated, minimizing the risk of errors while promoting iterative improvement.
By combining version control with LookML’s modularity, organizations can manage complex analytical ecosystems efficiently. Developers can implement new features, refine calculations, and adjust models without disrupting business operations, ensuring that insights remain reliable and consistent.
Understanding Facts, Dimensions, and Data Types
A nuanced understanding of facts, dimensions, and data types is indispensable for Looker developers. Facts represent quantitative measurements, such as sales, revenue, or operational throughput, while dimensions provide the categorical context, such as customer segments, product categories, or geographical regions. Correctly distinguishing between these elements allows developers to create coherent analytical structures and ensure that metrics are interpreted correctly.
Data types, including numeric, textual, date, and boolean, influence aggregations, calculations, and comparisons. Type casting and normalization may be necessary to reconcile inconsistencies across heterogeneous datasets. Looker developers must anticipate how different data types interact within calculations, visualizations, and derived metrics, ensuring that outputs are accurate and meaningful.
Derived Tables and Complex Aggregations
Derived tables are a powerful tool within Looker, enabling developers to precompute complex transformations, aggregations, or intermediate results. By defining derived tables, developers can enhance query performance, simplify recurring calculations, and ensure consistency across multiple analytical explorations.
Complex aggregations, such as cumulative sums, moving averages, or weighted measures, can be implemented within these derived structures. Symmetric aggregation ensures that calculations remain coherent across hierarchical dimensions and multiple perspectives, maintaining accuracy in subtotals, totals, and combined metrics. These capabilities allow developers to encode sophisticated business logic while preserving simplicity for end users.
Self-Service Enablement and User Empowerment
A primary objective of Looker development is to enable self-service analytics. Developers construct models, defines explores, and configure dashboards in a manner that allows business users to navigate data independently. By providing intuitive interfaces and structured pathways for exploration, Looker developers empower teams to generate insights without requiring deep technical expertise.
Self-service capability enhances organizational agility, as departments can respond rapidly to operational developments, test hypotheses, and monitor key performance indicators in real time. Developers play a critical role in designing these pathways, ensuring that users have access to relevant metrics, consistent definitions, and reliable visualizations.
Certification and Professional Development
While practical experience is invaluable, formal certification in Looker development provides a structured pathway for mastery. Certification programs cover LookML proficiency, advanced modeling techniques, security configurations, and best practices for collaborative development. Professionals who complete these programs gain confidence in their ability to implement robust analytical frameworks, navigate complex datasets, and maintain operational consistency.
Certification also signals credibility to organizations, reassuring stakeholders that analytical structures are designed competently and adhere to industry standards. It complements hands-on experience, equipping developers with the knowledge required to tackle real-world challenges effectively.
Advanced Security and Governance Practices
Looker developers are responsible for implementing security and governance frameworks within analytical ecosystems. Row-level and field-level access controls protect sensitive information while ensuring that users can access the data necessary for their operational responsibilities. Developers define these permissions in alignment with organizational policies and regulatory mandates, balancing accessibility with confidentiality.
Governance practices also encompass model approval workflows, version control audits, and change tracking. These measures ensure analytical integrity, maintain historical records, and facilitate compliance reporting. By embedding governance within the development process, Looker developers preserve the trustworthiness of insights and uphold organizational standards.
Optimization and Performance Management
Performance optimization is a critical competency for Looker developers. Large-scale datasets, complex joins, and interactive dashboards can strain underlying databases if not managed efficiently. Developers employ strategies such as indexing, query optimization, caching, and materialization of derived tables to maintain responsiveness and reliability.
Optimization ensures that users can explore data fluidly, generate reports rapidly, and interact with dashboards without delays. By balancing computational efficiency with analytical depth, Looker developers create environments that support both exploratory analysis and operational monitoring at scale.
Collaboration with Cross-Functional Teams
Looker developers often serve as intermediaries between technical teams and business stakeholders. Collaboration with finance, marketing, operations, and executive leadership ensures that models, dashboards, and metrics align with strategic objectives. Developers translate business requirements into analytical structures, validate assumptions, and provide guidance on best practices for data exploration.
This cross-functional collaboration ensures that insights are relevant, actionable, and aligned with organizational priorities. By maintaining an ongoing dialogue with stakeholders, Looker developers contribute to a culture of data-driven decision-making and continuous improvement.
Scalability and Adaptability in Analytics
As organizations expand, analytics platforms must scale seamlessly in both data volume and user access. Looker developers design models and workflows that accommodate growing datasets, additional users, and evolving business needs. Modular design, reusable metrics, and centralized definitions enable scalability while preserving analytical integrity.
Adaptability is equally important, as organizations may integrate new data sources, adopt novel metrics, or modify operational structures. Looker developers anticipate these changes and construct flexible models that can evolve without disrupting existing analytical ecosystems.
Predictive and Advanced Analytical Capabilities
Developers enhance Looker models to support advanced analytics and predictive modeling. By integrating historical data, trend analysis, and behavioral patterns, developers enable organizations to anticipate future outcomes, optimize operations, and identify opportunities. Predictive insights inform strategic planning, resource allocation, and risk mitigation, ensuring that analytics move beyond descriptive reporting toward proactive decision-making.
Advanced analytical capabilities also include cohort analysis, anomaly detection, and scenario modeling. Looker developers configure these methodologies within the platform, enabling business users to explore complex patterns, test hypotheses, and simulate operational scenarios with confidence.
Continuous Learning and Knowledge Sharing
The dynamic nature of business intelligence necessitates continuous learning for Looker developers. Emerging data sources, evolving business requirements, and technological advancements require developers to refine their skills, adopt new methodologies, and explore innovative analytical techniques.
Knowledge sharing within teams fosters consistency, promotes best practices, and enhances organizational capability. By mentoring colleagues, documenting processes, and disseminating insights, developers contribute to a culture of continuous improvement, ensuring that the organization maximizes the value of its analytical investments.
How Looker Distinguishes Itself in Business Intelligence
In the contemporary landscape of business intelligence, Looker stands apart due to its holistic approach to analytics, modeling, and integration. Unlike traditional platforms that primarily focus on reporting or visualization, Looker combines advanced data modeling, real-time exploration, and centralized governance to provide a comprehensive analytical framework. Its architecture supports interactive querying of live data, ensuring that insights are both current and actionable, a capability that distinguishes it from legacy tools that rely on batch processing or static data extraction.
Organizations leveraging Looker experience a transformative shift in their analytical culture. By providing a single source of truth, Looker eliminates inconsistencies that often arise from fragmented datasets. All departments, from finance and marketing to operations and executive leadership, work from the same definitions, metrics, and models, fostering coherence and strategic alignment. This unification enhances confidence in decision-making and reduces the risk of contradictory interpretations that can impede organizational agility.
Embedded Analytics for Operational Integration
Embedded analytics is one of Looker’s most compelling differentiators. This functionality allows organizations to integrate insights directly into operational workflows, applications, and third-party platforms. Stakeholders, partners, or customers can access tailored dashboards and analytical visualizations within the environments they already use, eliminating the need to switch between disparate tools.
By embedding analytics, organizations extend the reach of data-driven insights beyond internal teams. Operational systems become more intelligent, enabling users to make informed decisions in situ. Alerts, notifications, and dynamic dashboards can be configured to respond to thresholds or business events, ensuring that insights translate directly into action. This integration blurs the line between analysis and execution, embedding intelligence into the very fabric of organizational processes.
Embedded analytics also enables customization at scale. Organizations can tailor visualizations, metrics, and interactive elements to specific audiences, ensuring relevance and accessibility. By delivering insights within familiar workflows, Looker enhances adoption, reduces friction, and promotes a culture of continuous analytical engagement across teams.
Version Control and Collaborative Analytics
Version control is a critical element of Looker’s ecosystem, enabling multiple developers to collaborate on analytical projects without jeopardizing production environments. Every modification to models, dashboards, or calculations is tracked, reviewed, and approved prior to deployment. This ensures consistency, preserves analytical integrity, and provides a historical record of changes.
Collaborative development is facilitated by the integration with Git-based repositories, allowing developers to propose enhancements, refine calculations, and implement new metrics concurrently. This structured workflow fosters teamwork, accountability, and iterative improvement. It also allows organizations to manage complex projects with multiple contributors efficiently, ensuring that dashboards and models evolve in alignment with operational and strategic requirements.
By combining version control with LookML’s modular design, organizations can maintain agility while safeguarding the reliability of their analytical outputs. Developers can experiment with advanced metrics, optimize derived tables, and introduce innovative visualizations without risking disruptions to end-user dashboards or reports.
Customization and Scalability
Looker’s architecture supports extensive customization to meet diverse organizational requirements. Developers can define bespoke metrics, calculated measures, and tailored dimensions, ensuring that analytics reflect the unique operational realities of each enterprise. This flexibility allows organizations to capture complex business rules, nuanced KPIs, and specialized analytical perspectives.
Scalability is equally integral to Looker’s value proposition. The platform accommodates growing data volumes, expanding user bases, and increasingly complex models without sacrificing performance. Whether an organization operates with a few analytical users or thousands across multiple geographies, Looker maintains responsiveness, reliability, and coherence. Its cloud-compatible design ensures that performance scales with demand, supporting both self-service exploration and enterprise-level reporting.
Comparative Advantage Over Traditional BI Tools
Looker’s differentiation becomes particularly evident when compared to traditional BI platforms. Unlike tools that focus primarily on visualization or report generation, Looker integrates modeling, security, governance, and exploration into a unified environment. Its declarative approach allows developers to codify business logic centrally, ensuring that metrics are consistent across all dashboards and reports.
Furthermore, Looker’s in-database querying eliminates the latency and storage overhead associated with extracting or duplicating datasets for analysis. Insights are generated directly from live sources, preserving accuracy and timeliness. This contrasts with legacy systems that often rely on static snapshots, which may quickly become outdated in dynamic business environments.
Looker’s approach to embedded analytics, self-service exploration, and version-controlled development also distinguishes it from other tools. Business users can interact with data dynamically, while developers maintain control over definitions, access, and governance. This balance between empowerment and oversight positions Looker as a versatile and future-ready platform for enterprise analytics.
Advanced Security and Access Management
Security is a foundational aspect of Looker’s design. Organizations can implement fine-grained access controls that govern both row-level and field-level permissions. This ensures that users only access information pertinent to their roles, protecting sensitive data while enabling meaningful exploration. Security protocols are embedded directly within the modeling layer, allowing developers to enforce policies consistently across all analytical outputs.
Access management also supports regulatory compliance. Organizations operating under frameworks such as GDPR, HIPAA, or SOX can leverage Looker’s security features to restrict sensitive data, maintain audit trails, and document analytical workflows. This ensures that insights are reliable, defensible, and aligned with both internal standards and external mandates.
Support Systems and User Assistance
Effective support mechanisms are essential for maximizing the utility of business intelligence platforms. Looker provides robust support systems that address user queries, resolve technical issues, and facilitate onboarding. Organizations benefit from timely responses, expert guidance, and a structured escalation pathway that ensures operational continuity.
Additionally, Looker has cultivated a vibrant user community where practitioners share best practices, troubleshooting tips, and innovative approaches to modeling and visualization. This community-driven knowledge exchange complements formal support channels, providing organizations with multiple avenues for learning and problem resolution.
Support extends beyond troubleshooting to include guidance on optimization, performance tuning, and model enhancement. Organizations can leverage Looker’s expertise to refine dashboards, improve data integration, and implement advanced analytical techniques, ensuring that the platform continues to deliver value as business needs evolve.
Facilitating Cross-Functional Collaboration
Looker enhances collaboration across functional areas by providing a shared analytical framework. Marketing teams can track campaign performance and customer engagement metrics, while finance departments monitor revenue, costs, and forecasts. Operations teams gain insights into process efficiency, resource allocation, and service delivery. Executive leadership benefits from consolidated dashboards that provide a holistic view of organizational performance.
By centralizing definitions, measures, and analytical models, Looker ensures that all teams operate from the same assumptions and metrics. This cross-functional coherence promotes alignment, reduces misinterpretation, and accelerates decision-making. Teams can collaborate more effectively, using shared insights to coordinate initiatives, optimize processes, and execute strategy.
Embedding Insights into Business Workflows
The integration of analytics into daily workflows is a distinguishing feature of Looker. Insights are not confined to static dashboards but are embedded into operational applications, portals, and third-party systems. This integration allows stakeholders to make decisions in context, informed by real-time data and relevant metrics.
For example, sales representatives can access customer analytics directly within CRM platforms, enabling targeted engagement based on purchase history and behavioral patterns. Operations managers can monitor production metrics within planning tools, ensuring timely interventions. This seamless embedding of intelligence into workflows enhances efficiency, responsiveness, and decision accuracy.
Real-Time Analytics and Dynamic Monitoring
Looker’s ability to query live data supports real-time analytics and dynamic monitoring. Organizations can track KPIs, identify anomalies, and respond proactively to emerging trends. This capability is particularly valuable in sectors with high volatility or operational complexity, such as e-commerce, logistics, and finance.
Dynamic monitoring allows organizations to anticipate challenges, detect deviations from expected performance, and implement corrective measures immediately. By providing visibility into live operations, Looker empowers teams to act decisively and maintain alignment with strategic objectives.
Enhancing Predictive and Prescriptive Analytics
Looker supports advanced analytical methodologies, including predictive and prescriptive analytics. By analyzing historical data and behavioral patterns, organizations can forecast future outcomes, anticipate risks, and identify strategic opportunities. Prescriptive capabilities further extend these insights by recommending actions based on analytical findings, enabling proactive decision-making.
Predictive analytics informs resource allocation, demand planning, and risk management, while prescriptive analytics guides operational interventions and strategic initiatives. Together, these methodologies transform business intelligence from a descriptive discipline into a proactive driver of organizational performance.
Continuous Improvement and Iterative Development
Looker encourages continuous improvement and iterative development of analytical models. Developers can refine dimensions, measures, and dashboards over time, incorporating feedback from business users and responding to evolving organizational needs. This iterative approach ensures that analytics remain relevant, accurate, and aligned with strategic priorities.
Continuous improvement extends to performance optimization, security enhancements, and the incorporation of new data sources. Organizations benefit from an adaptive analytical environment that evolves in tandem with operational and market dynamics, supporting sustained value creation and decision-making excellence.
Knowledge Sharing and Training
Successful deployment of Looker relies not only on technical implementation but also on user education and knowledge dissemination. Organizations invest in training programs to familiarize users with dashboards, explores, and analytical workflows. Looker developers and analysts also document models, create usage guides, and facilitate workshops to promote effective adoption.
Knowledge sharing ensures that insights are accessible to a broad range of users, fostering data literacy and empowering teams to leverage analytics independently. By cultivating an informed user base, organizations maximize the utility of the platform and embed a culture of data-driven decision-making across all levels.
Strategic Impact of Looker in Organizations
The combination of embedded analytics, real-time exploration, robust security, collaborative development, and predictive capabilities positions Looker as a transformative tool for enterprises. Organizations that adopt Looker can navigate complex data landscapes, align operational and strategic initiatives, and empower users to derive insights independently.
Looker’s influence extends beyond analytics, shaping organizational culture, enhancing agility, and driving continuous improvement. By providing a unified, scalable, and adaptive platform, Looker ensures that data becomes an actionable asset, integral to decision-making and operational excellence.
Conclusion
Looker has established itself as a transformative force in the realm of business intelligence, combining advanced data modeling, real-time exploration, and centralized governance to empower organizations with actionable insights. By integrating seamlessly with diverse data sources, including relational databases, cloud warehouses, and hybrid environments, it enables enterprises to consolidate fragmented datasets into a coherent analytical framework. Its declarative modeling language allows developers to define dimensions, measures, derived metrics, and relationships consistently, providing a reliable foundation for both operational reporting and exploratory analysis.
The platform’s architecture emphasizes a single source of truth, ensuring that all stakeholders access consistent definitions and metrics, which fosters alignment and reduces misinterpretation across departments. Its in-database querying capabilities and caching mechanisms optimize performance while preserving data accuracy, allowing users to explore information dynamically without compromising operational efficiency. Looker’s embedded analytics extends insights into operational workflows, enabling decision-making in context and facilitating collaboration with external partners and internal teams alike.
Security and governance are deeply integrated, offering row-level and field-level access controls, auditability, and version-controlled development. This combination ensures compliance, preserves analytical integrity, and promotes accountability in complex enterprise environments. Self-service capabilities empower business users to interrogate data independently, accelerating insight generation and reducing reliance on technical intermediaries, while collaborative development frameworks allow multiple developers to enhance models concurrently without disrupting production dashboards.
Advanced functionalities such as predictive analytics, derived tables, symmetric aggregation, and calculated measures enable organizations to move beyond descriptive reporting toward proactive strategy formulation. Looker’s scalability and adaptability ensure that enterprises can expand analytical operations seamlessly, integrating new data sources, accommodating growing user bases, and refining models to meet evolving business requirements. Continuous improvement, knowledge sharing, and robust support systems reinforce adoption, enhance data literacy, and embed a culture of informed, data-driven decision-making.
Ultimately, Looker unifies technical sophistication with user accessibility, providing a comprehensive platform that transforms raw data into actionable intelligence. It supports operational optimization, strategic planning, and forward-looking analytics while enabling collaboration, security, and governance at scale. By centralizing data, standardizing analytical models, and facilitating real-time exploration, Looker empowers organizations to harness their data fully, enhancing efficiency, insight, and competitive advantage in a rapidly evolving business landscape.