Certification: Splunk O11y Cloud Certified Metrics User
Certification Full Name: Splunk O11y Cloud Certified Metrics User
Certification Provider: Splunk
Exam Code: SPLK-4001
Exam Name: Splunk O11y Cloud Certified Metrics User
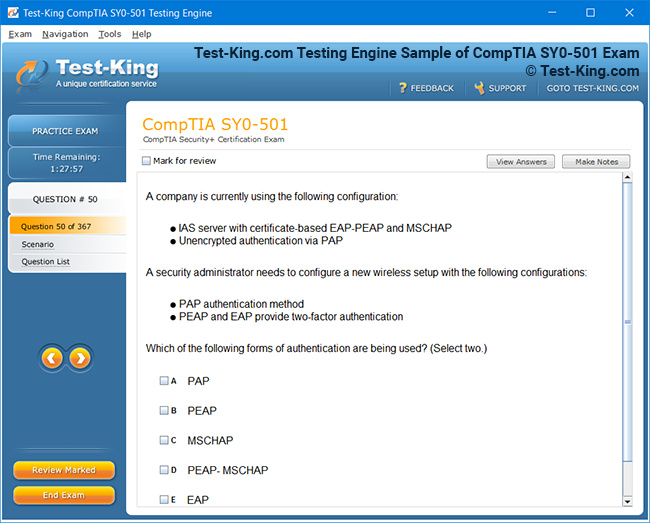
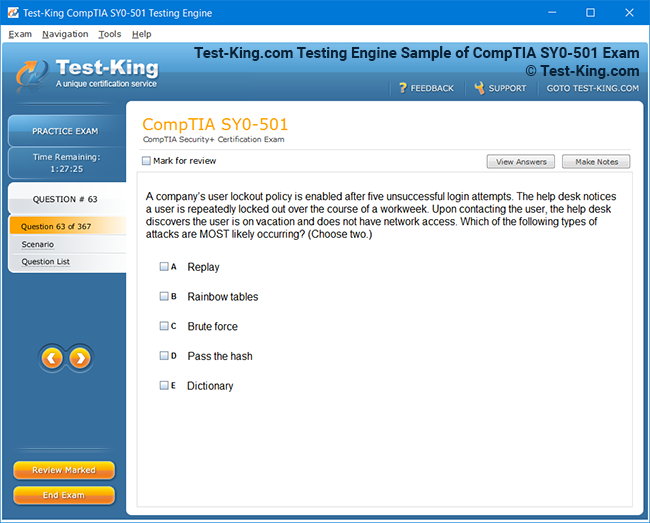
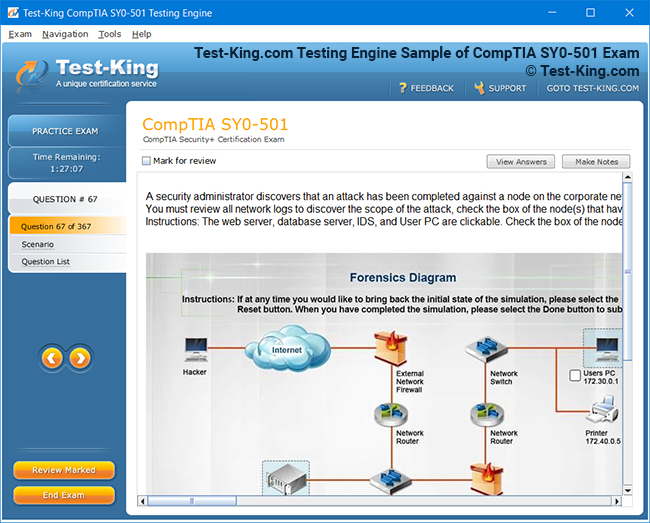
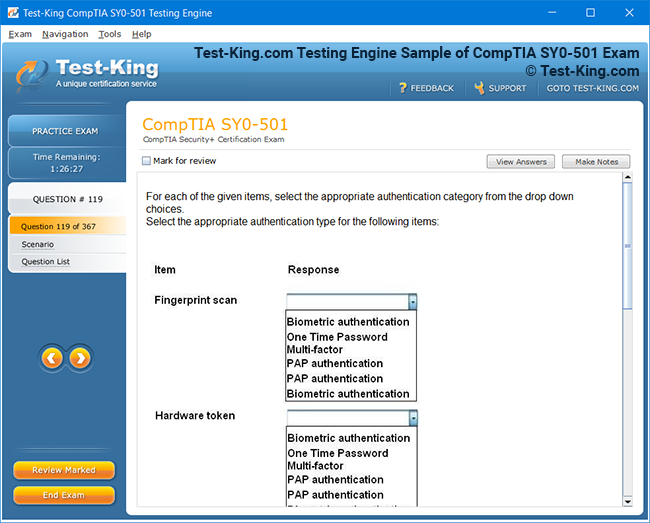
Product Screenshots

Mastering the Splunk O11y Cloud Certified Metrics User Exam: Introduction and Exam Overview
The journey toward becoming proficient in modern observability begins with a comprehensive grasp of metrics and their practical applications within complex infrastructures. The Splunk O11y Cloud Certified Metrics User Exam is designed to assess the capabilities of professionals in managing, interpreting, and acting upon metrics in a cloud-based environment. It serves as a benchmark for operational excellence, enabling individuals to demonstrate their proficiency in collecting, visualizing, and analyzing metrics efficiently. Professionals in DevOps, Site Reliability Engineering, and infrastructure monitoring roles find this certification particularly relevant because it emphasizes not only theoretical knowledge but also practical skills necessary for real-world scenarios.
Understanding the Splunk O11y Cloud Certified Metrics User Exam
The exam is tailored for a broad spectrum of candidates, from those with extensive experience in observability to newcomers seeking to establish a strong foundation. By taking this assessment, candidates prove their ability to configure monitoring solutions, deploy collectors, manage dashboards, and generate meaningful insights from metric data. The skills assessed encompass a wide range of observability practices, ensuring that certified professionals can optimize system performance, detect anomalies promptly, and facilitate data-driven decision-making.
The Splunk Observability Cloud provides a centralized platform where metrics, logs, and traces converge, enabling a holistic view of application performance and infrastructure health. The exam evaluates candidates on their familiarity with this platform, including the ingestion of metric data, the deployment of OpenTelemetry collectors, and the use of built-in content for monitoring purposes. Additionally, it emphasizes understanding data points, rollups, and resolution, which are essential for accurate analysis and interpretation of time-series metrics. The ability to navigate these elements with precision reflects a candidate’s readiness to manage complex observability environments.
Candidates are expected to be familiar with fundamental concepts of OpenTelemetry, including the installation and configuration of collectors on diverse operating systems and ensuring that metrics are transmitted seamlessly to the observability platform. Troubleshooting common issues during setup is an essential skill, as real-world deployments often encounter connectivity, configuration, or performance anomalies. The exam also explores the use of readers to capture and forward data efficiently, highlighting the importance of both technical setup and operational validation.
The examination format consists of multiple-choice questions, which require careful interpretation and application of knowledge. There are fifty-four questions to be completed within a sixty-minute timeframe, and a passing score of seven hundred out of one thousand is required to attain the certification. The cost of registration is one hundred thirty-five US dollars, and candidates can schedule their assessments through the Pearson VUE platform. Although the certification does not mandate formal prerequisites, a background in system administration, monitoring tools, or cloud technologies is advantageous.
One of the central objectives of the assessment is to gauge a candidate’s ability to implement effective metrics collection and monitoring strategies. Metrics in the Splunk Observability Cloud are structured through data points, multi-time series, and metadata. Understanding these constructs is critical for accurate analysis, enabling professionals to identify performance trends, detect irregularities, and optimize system configurations. Candidates must also demonstrate proficiency in configuring built-in dashboards, interpreting visualizations, and subscribing to notifications, which collectively enhance their operational insight.
The Splunk Observability Cloud Certified Metrics User Exam also evaluates the candidate’s understanding of monitoring Kubernetes clusters and other containerized environments. Using built-in dashboards, professionals can track nodes, pods, and application performance, detecting potential bottlenecks or failures before they escalate. The exam emphasizes practical familiarity with these tools, ensuring that candidates can translate theoretical knowledge into actionable solutions. Mastery of these skills enhances operational efficiency and strengthens an organization’s ability to maintain resilient systems.
Visualization plays a pivotal role in interpreting metric data, and the exam tests the ability to design comprehensive charts, dashboards, and widgets that provide clarity and actionable insight. Candidates are expected to demonstrate competence in selecting appropriate visual formats, grouping related metrics for effective interpretation, and leveraging rollups and analytic functions to refine the representation of time-series data. The ability to analyze charts critically allows professionals to discern patterns, anomalies, and trends that may not be immediately apparent, supporting proactive decision-making.
Alerting and notification management are equally emphasized. Professionals must configure detectors to identify deviations from expected behavior, set thresholds for automated alerts, and ensure that notification channels are aligned with operational priorities. The creation and management of muting rules to prevent alert fatigue, as well as the ability to clone and adapt existing detectors for new scenarios, are evaluated. Candidates are expected to apply these skills in contexts ranging from population monitoring to temporary or cyclic system behaviors, demonstrating versatility and precision.
Analytics is another core component, enabling candidates to extract deeper insights from the collected metrics. Techniques such as trend analysis, percentage-based comparisons, and ratio calculations allow professionals to contextualize data over time, while dynamic and calendar-based windows facilitate targeted examination of specific performance intervals. Using analytic functions effectively ensures that organizations can uncover hidden patterns, optimize processes, and predict potential disruptions before they impact end users. The exam challenges candidates to combine visualization, alerting, and analytic techniques into a cohesive approach for monitoring and improving system health.
Effective preparation for the exam involves a structured understanding of Splunk documentation, including user manuals, configuration guides, and training materials. The Splunkbase marketplace offers additional applications and add-ons that extend the functionality of the platform, providing practical scenarios for hands-on learning. Community forums such as Splunk Answers provide valuable insights, real-world problem-solving examples, and opportunities to interact with experienced professionals, further enhancing comprehension and confidence.
Practice is an integral part of preparation. Candidates are encouraged to simulate exam conditions, engage with sample questions, and familiarize themselves with typical problem-solving scenarios. This practice ensures familiarity with question types, reinforces core concepts, and enhances time management skills during the assessment. Mentorship or guidance from experienced observability professionals can provide additional clarity, particularly when navigating complex topics such as OpenTelemetry configuration or analytic function application.
The examination also evaluates a candidate’s ability to personalize dashboards and alerting mechanisms. This includes the configuration of single-instance panels, adaptation of notifications for specific operational contexts, and analysis of chart data for late or missing data points. Personalization ensures that metrics and alerts are relevant, actionable, and aligned with the operational goals of the organization. This capacity to tailor monitoring strategies is essential for managing diverse environments with varying performance expectations.
By integrating these capabilities—data ingestion, OpenTelemetry setup, visualization, alerting, and analytics—candidates demonstrate a comprehensive understanding of metric-driven observability. The certification represents not only mastery of the technical platform but also the application of these skills to enhance operational reliability, optimize infrastructure performance, and support data-driven decision-making. It underscores a candidate’s ability to synthesize complex information into actionable insights, making them a valuable asset in any DevOps or SRE team.
The Splunk O11y Cloud Certified Metrics User Exam emphasizes practical, real-world scenarios that reflect the dynamic nature of modern IT environments. Candidates must balance theoretical knowledge with hands-on problem-solving skills, demonstrating competence in configuring collectors, deploying dashboards, and responding to operational alerts. The ability to navigate these responsibilities efficiently reflects a professional’s readiness to manage observability in high-stakes environments, where downtime or performance degradation can have significant consequences.
Candidates are encouraged to approach preparation with a holistic mindset, integrating knowledge across multiple domains rather than focusing on isolated concepts. Understanding the interplay between metric collection, visualization, alerting, and analytics enables professionals to develop a cohesive observability strategy. By doing so, they are better equipped to diagnose issues rapidly, implement corrective measures, and continuously refine monitoring processes to align with evolving operational needs.
The exam’s emphasis on data accuracy and interpretation ensures that candidates appreciate the subtleties of metric analysis. Understanding how resolution, rollups, and data point configuration influence the fidelity of visualizations and alerts is critical. Professionals must also navigate complex metadata structures to ensure that metrics are categorized and interpreted correctly, supporting accurate reporting and actionable insights. This attention to detail distinguishes proficient observability practitioners from those who rely solely on superficial monitoring metrics.
In addition to technical competencies, the exam assesses problem-solving acumen, analytical reasoning, and the ability to synthesize information from multiple sources. Candidates must demonstrate skill in integrating metrics from diverse systems, interpreting trends, and deploying alerts that are both precise and actionable. The capacity to combine quantitative analysis with operational context reflects advanced observability expertise, which is highly valued in enterprise environments.
Mastering the Splunk O11y Cloud Certified Metrics User Exam requires not only diligent study but also immersion in the practical application of monitoring principles. Engaging with real-world datasets, experimenting with dashboard configurations, and interpreting alerts under varying conditions provides the experiential knowledge necessary to excel. This hands-on experience reinforces theoretical learning and builds confidence in applying skills in operational settings.
The certification provides a competitive advantage in the job market, signaling to employers that the candidate possesses a verified capability in metric-based observability. It establishes credibility in roles that demand rigorous monitoring, proactive issue resolution, and data-driven decision-making. As organizations increasingly rely on complex cloud-native environments, the ability to manage and analyze metrics effectively becomes a distinguishing factor for professionals seeking to advance their careers.
By fostering a deep understanding of metrics, visualization techniques, alerting strategies, and analytics, the exam prepares candidates to handle the intricacies of modern observability platforms. It equips them to anticipate system behavior, detect anomalies, and implement optimizations that enhance overall performance. The knowledge and skills gained through this certification are transferable across diverse infrastructure landscapes, ensuring that professionals can adapt to new technologies and evolving operational requirements.
The exam also encourages candidates to cultivate a strategic mindset, emphasizing the importance of prioritizing critical metrics, designing meaningful dashboards, and creating alerts that reflect operational priorities. This approach promotes efficiency, reduces noise from unnecessary notifications, and enhances the organization’s ability to respond swiftly to issues. The development of these strategic skills complements technical expertise, producing well-rounded observability professionals capable of driving impactful operational improvements.
Understanding Metrics and Data Points
The realm of observability demands a nuanced comprehension of metrics, as they form the backbone of monitoring and operational insight. Metrics are structured representations of system performance, encapsulating values over intervals of time. Each data point within a metric carries information not only about the measurement itself but also about its context, which can include tags, timestamps, and metadata. The resolution of metrics determines the granularity of analysis, influencing how trends, anomalies, and patterns are perceived across short or extended periods. A fine resolution provides detailed insights into transient behaviors, while aggregated rollups offer a broader perspective of long-term performance.
A comprehensive understanding of multi-time series structures is crucial for monitoring complex environments. Multi-time series facilitate the grouping of related metrics, allowing professionals to analyze variations across multiple dimensions simultaneously. Each series carries its own set of data points and metadata, which must be configured accurately to ensure that the resulting analysis reflects the true state of the system. Metadata classification enhances the ability to segment, filter, and interpret metrics efficiently, enabling focused troubleshooting and precise decision-making.
The configuration of data points and the management of resolution are instrumental in preventing misinterpretation of metrics. When defining metrics, it is essential to consider how rollups affect aggregated views. Rollups consolidate data over intervals, simplifying visualization and reducing noise, yet they can mask subtle fluctuations if applied indiscriminately. Understanding the interplay between raw data, rollups, and analytical functions allows observability professionals to strike a balance between granularity and clarity, ensuring meaningful insights without overwhelming dashboards.
Configuring Splunk IM Data Models
Within the Splunk Observability Cloud, the data model provides the framework for structuring and interpreting metrics. Components such as metrics, multi-time series, and data points must be carefully configured to align with the monitoring goals. The data model determines how metrics are categorized, aggregated, and visualized, influencing the accuracy and relevance of the insights derived. Professionals must be adept at defining relationships between metrics, understanding dependencies, and applying metadata consistently to maintain coherence across dashboards and analytic functions.
Creating a robust data model involves anticipating operational needs and potential anomalies. By structuring metrics with clarity, professionals enable more effective monitoring, alerting, and visualization. A well-defined model supports both high-level overviews and detailed investigations, allowing stakeholders to navigate seamlessly from aggregated trends to granular data points. This approach ensures that operational decisions are informed by precise and contextualized metric information.
Installation and Configuration of OpenTelemetry Collector
The deployment of OpenTelemetry collectors is a foundational task for transmitting metrics to the observability platform. Installing the collector on diverse operating systems requires familiarity with system-level configurations, dependencies, and network considerations. The collector acts as a conduit, capturing telemetry from multiple sources, converting it into a standardized format, and forwarding it reliably to the platform for analysis.
Configuration of the collector encompasses defining sources, specifying data formats, and establishing transmission protocols. It is critical to ensure that metrics are collected without loss, latency, or distortion. Misconfiguration can lead to incomplete or misleading data, compromising the accuracy of dashboards and analytic results. Observability professionals must validate installations through systematic testing, confirming that the collector reports metrics accurately and consistently under varying workloads.
Troubleshooting during deployment is an inevitable aspect of real-world observability. Common issues may include connectivity problems, incorrect source definitions, or conflicts with existing monitoring agents. Professionals must apply diagnostic skills, examining logs, verifying network paths, and adjusting configurations to restore proper data flow. Mastery of these troubleshooting techniques ensures that the observability platform remains reliable and that alerts and analytics reflect true operational conditions.
Utilizing OpenTelemetry Readers
Readers in the OpenTelemetry framework serve as intermediaries that aggregate, filter, and forward metrics for further processing. Setting up readers involves specifying collection endpoints, mapping metric streams, and ensuring synchronization with the central platform. Proper configuration guarantees that metrics from diverse sources are aligned temporally and semantically, preventing discrepancies that could hinder accurate analysis.
A thorough understanding of the interaction between collectors and readers is essential for maintaining data fidelity. Readers allow professionals to manage the flow of telemetry efficiently, applying transformations, filtering unnecessary data, and forwarding critical metrics to the platform. This architecture supports scalable monitoring, enabling large-scale deployments to maintain consistent performance and provide actionable insights across distributed systems.
Troubleshooting Metrics Collection
Operational environments are rarely static, and the observability professional must be prepared to address irregularities in metric collection. Issues may arise from misconfigured collectors, intermittent network failures, or unexpected changes in source systems. Identifying the root cause requires a methodical approach, analyzing both the configuration and the resulting metrics to detect anomalies or gaps.
Metrics may appear delayed, missing, or inconsistent due to sampling errors, rollup misalignment, or aggregation misconfigurations. Professionals must interpret these discrepancies with care, distinguishing between genuine operational anomalies and artifacts of collection or processing. Effective troubleshooting enhances confidence in dashboards, ensures alerts are triggered appropriately, and maintains the integrity of analytic functions that rely on accurate data.
Fundamental OpenTelemetry Concepts
OpenTelemetry is founded on principles that emphasize standardization, extensibility, and interoperability. Metrics, traces, and logs are collected in a consistent format, enabling cross-platform observability and seamless integration with diverse monitoring tools. Understanding the conceptual underpinnings of OpenTelemetry is essential for deploying collectors, configuring readers, and designing robust telemetry pipelines.
Key concepts include the standardization of metric types, the propagation of context across distributed systems, and the modular architecture that allows customization without sacrificing reliability. Professionals must internalize these principles to design scalable and maintainable observability solutions. By adhering to OpenTelemetry standards, metrics remain coherent, comparable, and actionable, even as systems evolve and grow in complexity.
Practical Implications of Metrics and OpenTelemetry Setup
The real-world impact of precise metrics configuration and reliable telemetry collection is profound. Metrics provide early indicators of system degradation, enabling preemptive interventions that prevent downtime and maintain service levels. Properly deployed collectors and readers ensure that these indicators are accurate, timely, and complete, supporting operational decisions with confidence.
Visualization and analysis rely heavily on the integrity of collected metrics. Dashboards, charts, and widgets transform raw data into comprehensible narratives, highlighting trends, anomalies, and performance bottlenecks. The interplay between meticulous metric configuration, effective telemetry deployment, and informed visualization underpins a proactive monitoring strategy, where issues are detected and resolved before they impact users or business outcomes.
Advanced Considerations in Metric Modeling
Beyond basic collection, professionals must consider advanced modeling techniques to maximize insight. Multi-dimensional metrics allow the segmentation of data across multiple attributes, revealing patterns that might remain hidden in aggregated views. Temporal alignment, normalization, and the application of analytic functions enhance interpretability, enabling detailed investigations into causes of anomalies and variations.
Understanding the lifecycle of a metric, from collection through transformation to visualization, is crucial. Each stage introduces potential sources of distortion or error, requiring careful oversight and validation. Professionals must implement monitoring pipelines that preserve fidelity while enabling scalable analysis, ensuring that metrics remain reliable indicators of operational reality.
Integration with Observability Workflows
The deployment of OpenTelemetry and the structuring of metrics feed directly into broader observability workflows. Data collected from diverse systems can be correlated, analyzed, and visualized within a unified platform, enabling comprehensive insights into application behavior and infrastructure performance. This integration supports incident response, capacity planning, and performance optimization, allowing teams to act with agility and precision.
Metrics collected through OpenTelemetry inform alerts, dashboards, and analytic queries, creating a cohesive feedback loop. By understanding the relationships between collectors, readers, and the central platform, professionals can maintain a resilient observability ecosystem. This ecosystem enables continuous monitoring, rapid diagnosis, and informed decision-making, which are critical in high-demand environments where reliability and responsiveness are paramount.
Building Expertise in Metrics Analysis
Mastery of metrics analysis requires both conceptual knowledge and practical experience. Professionals must develop an intuition for interpreting data, recognizing meaningful deviations, and applying corrective measures. Hands-on experimentation with collectors, readers, and dashboards reinforces theoretical understanding, fostering the ability to respond dynamically to operational challenges.
The continuous evolution of infrastructure and applications demands ongoing learning. Observability professionals must adapt to changes in system architecture, telemetry standards, and analytic techniques. By cultivating a deep understanding of metrics concepts, OpenTelemetry deployment, and data modeling, practitioners ensure that their monitoring strategies remain effective, relevant, and aligned with organizational objectives.
Enhancing Operational Reliability
Accurate metrics and reliable telemetry collection directly enhance operational reliability. By providing timely insights into system behavior, professionals can anticipate potential disruptions, optimize resource allocation, and maintain service quality. The ability to distinguish between transient fluctuations and genuine anomalies ensures that interventions are targeted, minimizing unnecessary disruptions while addressing critical issues.
The strategic configuration of metrics, collectors, and readers enables organizations to monitor both high-level trends and granular events. This dual perspective supports comprehensive operational oversight, allowing teams to balance immediate responsiveness with long-term optimization. Professionals skilled in these areas contribute to resilient, efficient, and adaptive observability practices that underpin modern digital operations.
The Role of Metrics in Predictive Analysis
Metrics serve as the foundation for predictive analysis, where historical patterns inform future expectations. By analyzing trends, correlations, and cyclical behaviors, observability professionals can forecast potential issues, optimize system performance, and guide capacity planning. The reliability of these predictions depends on the integrity of the collected data, underscoring the importance of meticulous configuration and continuous monitoring.
Effective predictive analysis requires a sophisticated understanding of data behavior, including normalization, aggregation, and anomaly detection. Professionals must interpret subtle variations, account for environmental factors, and integrate insights across multiple metric dimensions. This capability transforms raw measurements into actionable foresight, empowering proactive management of complex systems.
Metrics Visualization and Dashboard Creation
In the realm of observability, the ability to convert numerical and temporal data into coherent visual representations is essential for understanding complex systems. Visualization is not merely the act of presenting data but the process of transforming raw metrics into actionable narratives. Professionals must cultivate the skill to design dashboards and charts that reveal performance trends, anomalies, and interdependencies across applications and infrastructure. Each visualization element, from a simple line chart to a sophisticated multi-dimensional widget, contributes to the overarching insight into system behavior. Dashboards serve as the operational canvas where metrics converge, allowing real-time assessment of system health and the identification of critical bottlenecks.
Creating a visualization requires deliberate decisions about which metrics to display, how to group them, and the appropriate types of charts for different kinds of data. Line charts are effective for illustrating trends over time, while bar graphs excel at comparing discrete values. Heatmaps can reveal density or intensity patterns, offering nuanced insight into fluctuating workloads or resource utilization. The professional must also consider rollups, aggregation methods, and resolution, as these parameters influence the fidelity of the visual interpretation. Improper application can obscure essential variations or amplify insignificant fluctuations, potentially leading to misguided operational decisions.
Effective dashboards integrate multiple visual elements to provide both high-level overviews and granular detail. Grouping related metrics into showcase areas enables observers to understand interrelated behaviors and dependencies quickly. For example, a cluster of metrics representing CPU, memory, and network usage can illustrate resource contention patterns in a single glance. Adding contextual metadata to each metric further enriches interpretation, allowing rapid identification of the affected system, environment, or application. This approach ensures that visualizations are not only informative but also intuitive, promoting faster comprehension and informed action.
Interpreting Charts and Analytic Functions
Interpreting charts goes beyond recognizing trends; it demands a critical understanding of how data is processed and aggregated. Rollups, which consolidate multiple data points into a summary measure over a specified interval, are essential for clarity but can mask transient spikes or dips. Observability professionals must balance granularity and readability, choosing intervals and aggregation techniques that preserve meaningful variation while avoiding overwhelming detail. Analytic functions such as averages, percentiles, and rate calculations enhance the utility of visualizations, enabling the detection of anomalies, performance degradation, or unusual behavioral patterns.
Analytic functions applied to dynamic and calendar-based windows allow professionals to examine metrics in context. By comparing current behavior to historical baselines or specific time frames, subtle deviations become apparent. This capability is crucial for predictive monitoring, where early warning signs of instability or resource exhaustion can inform proactive interventions. Accurate interpretation requires a deep familiarity with the underlying data, its structure, and any transformations applied during collection or rollup, ensuring that insights drawn from visualizations reflect operational reality.
Using Built-in Content for Efficient Monitoring
Splunk Observability Cloud provides a suite of pre-configured dashboards and monitoring tools designed to streamline the observation of applications and infrastructure. Built-in content serves as a foundation for both novice and experienced professionals, offering immediate access to critical metrics and operational indicators without extensive setup. This content includes dashboards that track containerized environments, Kubernetes clusters, and cloud infrastructure, highlighting performance metrics and potential issues in real-time.
Leveraging built-in content involves more than passive observation; professionals must actively interact with these dashboards, interpreting charts, subscribing to notifications, and correlating metrics across systems. For instance, a Kubernetes monitoring dashboard provides insights into node health, pod performance, and cluster-wide resource utilization, enabling rapid identification of failures or bottlenecks. By understanding the relationships between metrics and their operational impact, observers can prioritize interventions and maintain system stability effectively.
The integration of built-in dashboards with alerts and detectors amplifies operational efficiency. Observers can define thresholds for key metrics, trigger notifications for deviations, and correlate events across multiple systems. This proactive approach transforms monitoring from a passive activity into an active management strategy, where potential problems are addressed before they escalate. Observers must also be capable of customizing built-in content to reflect unique operational requirements, ensuring that dashboards and alerts are aligned with organizational priorities.
Personalizing Dashboards and Alerts
Creating dashboards tailored to specific operational contexts enhances clarity and usability. Professionals can configure single-instance panels to focus on critical systems, ensuring that vital metrics are always in view. Widgets can be grouped based on functional relevance, application architecture, or service-level objectives, providing intuitive navigation through complex datasets. Personalization extends to alert messages, allowing the content and delivery channels to reflect the urgency and type of event, ensuring that the right personnel are notified promptly and accurately.
Custom dashboards and alerts must also account for the behavior of late or missing data points. Delayed metrics can distort trends and generate misleading alerts, while gaps in data may obscure critical patterns. Observers need strategies to mitigate these issues, such as configuring extrapolation policies, adjusting thresholds dynamically, or integrating analytic functions that account for irregularities. The combination of tailored dashboards, precise alerts, and adaptive analytics supports resilient monitoring practices that maintain accuracy under varying operational conditions.
Identifying Patterns and Anomalies
Visualization is particularly valuable for recognizing patterns and detecting anomalies that are not immediately apparent in raw numerical data. Observers must be adept at correlating metrics, understanding cyclic behaviors, and discerning transient deviations from systemic issues. Multi-dimensional visualizations facilitate the identification of relationships between disparate metrics, such as the correlation between database latency, CPU utilization, and network throughput. Recognizing these interdependencies enables targeted interventions that address root causes rather than symptoms.
Heatmaps, histograms, and percentile-based charts are effective tools for identifying patterns that are subtle or intermittent. By visualizing density, distribution, or frequency, observers can detect recurring issues, seasonal variations, or capacity thresholds approaching saturation. This capability is essential for maintaining service reliability, optimizing resource allocation, and preventing performance degradation. Visualization thus functions as both a diagnostic and predictive tool, guiding operational decision-making with precision.
Analytics and Comparative Insights
Analytics enhance visualization by providing comparative and contextual perspectives. Observers can examine metrics across multiple dimensions, such as time windows, system components, or deployment environments, to gain comprehensive insights. Comparative analysis reveals trends, highlights anomalies, and supports strategic planning, allowing teams to understand not only what has occurred but also why it happened and how to respond effectively.
Percentages, ratios, and rate calculations applied within visualizations offer additional clarity, especially when comparing systems of differing scales or capacities. Analysts can normalize metrics, examine proportional changes, and identify deviations that may not be obvious in absolute terms. This analytical approach transforms raw visualization into actionable intelligence, enabling operational teams to prioritize efforts and allocate resources efficiently.
Practical Application of Built-in Content
In practice, built-in dashboards are frequently used to troubleshoot operational issues, monitor ongoing performance, and support incident response. Observers can drill down from high-level summaries to individual metrics, identifying anomalies in CPU utilization, memory consumption, or network traffic. Integration with detectors and alerts ensures that deviations trigger timely notifications, allowing teams to respond before incidents impact users. Customizing built-in content for specific applications or infrastructure components ensures that monitoring remains relevant and actionable, even as operational environments evolve.
Regular interaction with built-in dashboards fosters situational awareness, as observers develop an understanding of typical system behavior and expected metric ranges. Familiarity with these dashboards enables professionals to distinguish between normal fluctuations and critical anomalies, enhancing both efficiency and accuracy in operational monitoring. The combination of visual interpretation, analytic insight, and alerting ensures that observability is proactive rather than reactive, allowing teams to maintain system stability and optimize performance continuously.
Integrating Visualization with Operational Strategies
Visualization and monitoring built-in content are most effective when integrated into broader operational strategies. Metrics collected through OpenTelemetry and other sources feed into dashboards, enabling correlation, trend analysis, and anomaly detection. This integration supports capacity planning, performance optimization, and risk management, allowing organizations to anticipate and mitigate potential disruptions.
Observers must consider how visualization informs decision-making, resource allocation, and incident management. The clarity provided by dashboards and charts guides operational actions, helping teams identify priority issues, allocate personnel, and deploy resources strategically. Visualization thus serves as both a tool for immediate monitoring and a foundation for long-term planning, linking real-time insights with strategic objectives.
Enhancing Decision-Making through Visualization
The ultimate value of metrics visualization and built-in dashboards lies in their ability to inform decision-making. Observers can identify patterns, detect anomalies, and evaluate performance trends with confidence. The combination of intuitive design, accurate data representation, and analytic augmentation empowers teams to respond swiftly to operational challenges. Insights derived from visualization support proactive interventions, ensuring that systems operate reliably and efficiently under diverse conditions.
By cultivating expertise in chart interpretation, dashboard configuration, and analytic application, professionals enhance their capacity to translate data into actionable knowledge. Visualization thus becomes a bridge between raw metrics and informed operational action, reinforcing the role of observability as a cornerstone of resilient and optimized infrastructure management.
Advanced Visualization Techniques
Advanced visualization techniques include multi-dimensional charting, composite dashboards, and interactive widgets that allow dynamic exploration of metrics. Observers can filter data, adjust time ranges, and correlate metrics from disparate sources, uncovering insights that might remain hidden in static views. Interactive visualizations facilitate hypothesis testing, root cause analysis, and scenario simulation, enabling professionals to anticipate potential issues and optimize system performance proactively.
The integration of analytic functions within these visualizations amplifies their utility. Trend lines, rate calculations, and percentile analyses enhance interpretability, enabling rapid identification of deviations from expected behavior. By combining these techniques, observers can create comprehensive dashboards that support real-time monitoring, strategic planning, and predictive analysis, ensuring that operational insight is both deep and actionable.
Creating and Managing Real-Time Alerts
Effective observability requires the ability to detect deviations in system performance and respond promptly to emerging issues. Real-time alerts serve as the mechanism for translating metrics into actionable signals. Observers must configure alert conditions that accurately reflect operational priorities, ensuring that critical events trigger notifications while minimizing false positives. Thresholds can be defined using absolute values, statistical deviations, or anomaly detection functions, each approach offering a different lens for evaluating system behavior. Alerts can be applied to individual metrics, multi-time series, or aggregated values, allowing flexible monitoring across diverse environments.
Alerts are not merely reactive instruments; they facilitate proactive interventions. By analyzing historical trends, observers can set thresholds that anticipate potential degradation, providing early warning signals before incidents impact users. The precision of alert configuration determines the efficiency of incident response and the ability to allocate resources strategically. Professionals must also account for temporal aspects, such as delayed data points, missing values, or irregular metric intervals, ensuring that notifications remain meaningful and timely.
Muting rules are a critical component of alert management, preventing alert fatigue in environments with fluctuating metric patterns. Observers can configure rules to suppress notifications during planned maintenance, transient spikes, or periods of low operational relevance. The design of these rules requires an understanding of operational context, metric behavior, and the interplay between different alerts. Properly implemented, muting strategies preserve the salience of alerts, ensuring that attention is directed toward genuinely significant events.
Configuring Detectors for Operational Monitoring
Detectors are specialized constructs that evaluate metrics against defined criteria, generating alerts when conditions are met. Observers can create detectors based on a single metric, multi-metric aggregation, or comparative analysis across time intervals. Cloning existing detectors allows rapid deployment of monitoring patterns across similar systems, while customization ensures alignment with unique operational requirements. Detectors may track cyclic behavior, monitor populations of systems, or focus on temporary conditions, providing nuanced visibility into diverse operational scenarios.
Diagnosing issues with detectors involves evaluating their configuration, analyzing triggered alerts, and understanding metric interactions. Observers must identify whether alerts are symptomatic of genuine performance anomalies or artifacts of detector design. This analytical process requires familiarity with metric resolution, rollups, and analytic functions, as well as the ability to correlate metrics across systems. By refining detector logic, observers can enhance the reliability of alerting mechanisms and reduce unnecessary notifications.
Detectors also support advanced use cases, such as population monitoring, where the behavior of multiple instances is evaluated collectively to identify systemic deviations. This approach is particularly valuable in distributed environments, where isolated anomalies may be less significant than patterns emerging across multiple systems. Observers must balance sensitivity and specificity, ensuring that detectors capture meaningful deviations without generating excessive noise.
Optimizing Dashboards for Operational Efficiency
Dashboards serve as the focal point for observing and interpreting system metrics. Creating efficient dashboards involves strategic selection and arrangement of widgets, charts, and visual components to maximize clarity and insight. Single-instance panels allow focused monitoring of critical systems, while grouped widgets provide context by presenting related metrics together. Observers must consider the logical flow of information, emphasizing key metrics while enabling drill-down into granular data for detailed analysis.
Personalization of dashboards enhances usability and operational relevance. Observers can tailor views to specific roles, responsibilities, or operational priorities, ensuring that each stakeholder accesses the metrics most pertinent to their tasks. Custom alert messages, integrated within dashboards, facilitate rapid interpretation of deviations, guiding timely interventions. Effective dashboards integrate analytic functions and comparative visualizations, enabling users to discern trends, detect anomalies, and understand the impact of system behavior on broader operational objectives.
Monitoring dashboard activity is essential for maintaining situational awareness. Observers track interactions with panels, evaluate performance trends, and assess the effectiveness of visual representations. Adjustments may include reorganizing widgets, updating metric groupings, or modifying visualization types to enhance interpretability. By iteratively refining dashboards, professionals create an environment where metrics are actionable, insights are immediate, and operational decisions are informed by coherent visual narratives.
Analyzing Late or Missing Data Points
Operational environments are dynamic, and metrics may arrive late or be temporarily unavailable due to network latency, system disruptions, or collection anomalies. Observers must interpret these irregularities within the context of dashboards and detectors, distinguishing between transient data gaps and genuine operational anomalies. Extrapolation policies, analytic adjustments, and dynamic thresholds can mitigate the impact of incomplete data, ensuring that visualizations and alerts continue to provide accurate insight.
Understanding the causes of late or missing data points informs corrective actions. Observers may adjust collector configurations, refine data pipelines, or implement redundancy mechanisms to maintain metric integrity. This proactive management enhances reliability and ensures that dashboards and alerts reflect operational reality, supporting confident decision-making under varying conditions.
Detecting and Diagnosing Patterns and Anomalies
Detectors and dashboards collectively support the identification of patterns and anomalies within operational metrics. Observers analyze multi-dimensional visualizations to uncover correlations between metrics, detect cyclic behaviors, and identify deviations from expected norms. Patterns may manifest across time, populations, or interdependent systems, requiring sophisticated interpretation to differentiate significant trends from noise.
Diagnostic processes involve correlating metric behaviors, evaluating detector outputs, and cross-referencing visualizations with historical baselines. Observers must consider environmental factors, operational dependencies, and the influence of analytic transformations when interpreting deviations. Effective diagnosis enables targeted interventions, addressing root causes rather than surface-level symptoms, and promotes the stability and reliability of systems under observation.
Integrating Alerts, Detectors, and Dashboards
Operational insight is maximized when alerts, detectors, and dashboards function in a cohesive ecosystem. Metrics collected through OpenTelemetry and other sources feed into detectors, which evaluate conditions and trigger alerts as necessary. Dashboards visualize these metrics and alerts, providing stakeholders with a comprehensive understanding of system performance and operational risk. Integration ensures that anomalies are detected promptly, interventions are guided by accurate data, and resources are allocated efficiently to maintain service reliability.
This integrated approach requires an understanding of the interplay between collection, evaluation, and visualization. Observers must configure pipelines that preserve metric fidelity, design detectors that capture meaningful deviations, and craft dashboards that convey insight effectively. The synergy between these components enables proactive monitoring, where potential issues are identified and addressed before they escalate, supporting both operational efficiency and strategic planning.
Advanced Detector Configurations
Advanced detector configurations extend basic alerting by incorporating statistical models, dynamic thresholds, and multi-metric correlations. Observers can implement percentile-based evaluations, trend-based predictions, and anomaly detection algorithms to capture deviations that traditional thresholds might miss. These configurations require an understanding of metric behavior, temporal patterns, and system interdependencies, allowing for more sophisticated and accurate alerting.
Custom detectors can be designed to monitor complex scenarios, such as populations of microservices, high-frequency workloads, or temporary infrastructure deployments. By leveraging historical data and analytic functions, observers refine detector sensitivity, minimize false positives, and enhance the overall reliability of monitoring frameworks. Advanced configurations enable organizations to maintain high observability standards in increasingly complex and distributed operational environments.
Enhancing Operational Awareness through Dashboards
Dashboards not only provide visualization but also foster situational awareness and decision-making agility. Observers interpret real-time metrics, detect trends, and anticipate potential operational disruptions. Integrating analytic insights within dashboards allows for contextual evaluation, enabling stakeholders to understand both immediate conditions and broader systemic behaviors. Dashboards become a central hub for operational intelligence, guiding responses, resource allocation, and strategic planning.
Interactive elements within dashboards, such as drill-downs, filters, and dynamic widgets, empower observers to explore metrics from multiple perspectives. This flexibility facilitates root cause analysis, hypothesis testing, and scenario modeling, ensuring that decisions are grounded in comprehensive and reliable data. The thoughtful design and continuous refinement of dashboards support sustained operational excellence, providing a foundation for both reactive and proactive management.
Strategic Application of Alerting and Detectors
The strategic deployment of alerts and detectors aligns monitoring activities with organizational priorities and service-level objectives. Observers prioritize critical metrics, configure notifications to reach appropriate personnel, and design detectors to balance sensitivity and specificity. By integrating these elements with dashboards, teams create a resilient monitoring environment where deviations are detected, analyzed, and addressed efficiently.
Alerting strategies must consider operational context, including maintenance schedules, workload patterns, and temporal variations. Observers refine thresholds, apply muting rules, and adjust detector configurations to maintain relevance and accuracy. This strategic approach ensures that monitoring efforts are focused, resources are utilized effectively, and operational risks are mitigated proactively.
Leveraging Analytic Functions for Dashboard Optimization
Analytic functions enhance dashboard effectiveness by providing deeper insight into metric behavior. Observers can apply rate calculations, percentile analyses, and trend comparisons to reveal subtle anomalies, emerging patterns, and long-term performance shifts. These functions enable the aggregation of multi-dimensional metrics, normalization of diverse data sources, and evaluation of temporal variations, transforming raw measurements into actionable intelligence.
By integrating analytic functions into dashboards, observers create a dynamic monitoring environment that adapts to evolving operational conditions. Visualizations become more informative, alerts more precise, and decision-making more confident. The combination of real-time monitoring, analytic rigor, and strategic alerting supports robust operational practices that maintain system stability, performance, and reliability.
Using Analytics to Gain Operational Insights
Observability in modern digital infrastructures hinges on the ability to derive meaningful insights from a multitude of metrics. Analytics serve as the prism through which raw data is transformed into actionable knowledge. Observers employ analytic functions to dissect multi-dimensional metrics, uncover correlations, and interpret variations over time. By applying filters, aggregations, and transformations, patterns hidden within complex datasets are revealed, enabling professionals to understand not only what is occurring in a system but also why it is happening.
Analytic workflows often involve comparisons across multiple time intervals, systems, or operational environments. By examining trends in both historical and real-time data, observers can detect deviations from expected behavior, identify latent performance issues, and anticipate potential disruptions. Percentiles, averages, and rate calculations are frequently used to normalize metrics across disparate scales, making comparisons meaningful and actionable. The integration of analytic functions within dashboards enhances the clarity of visualizations, ensuring that patterns and anomalies are evident at a glance.
Trend Analysis and Pattern Recognition
Trend analysis provides the framework for understanding the temporal evolution of system metrics. Observers track performance indicators over hourly, daily, or monthly intervals, detecting cyclical behaviors, seasonal variations, and emerging bottlenecks. Recognizing trends allows teams to plan resource allocation, optimize capacity, and preemptively address conditions that could degrade service quality. Advanced analytic tools enable the examination of subsets of multi-time series metrics, allowing focused analysis on critical components or segments of an application environment.
Pattern recognition extends beyond temporal analysis, encompassing the correlation of metrics across systems and layers. Observers may detect synchronized spikes in resource utilization, recurring anomalies in container clusters, or transient deviations in service latency. By understanding the interdependencies between metrics, professionals can identify systemic issues, differentiate between isolated incidents and broader operational trends, and implement interventions that address root causes rather than superficial symptoms.
Comparative Analysis Across Metrics
Comparative analysis involves evaluating metrics against historical baselines, similar systems, or predefined thresholds. This process highlights deviations that could indicate inefficiencies, failures, or emerging risks. By contextualizing metrics within the operational landscape, observers can prioritize investigations, focus on high-impact areas, and ensure that monitoring resources are allocated effectively. Ratios, percentages, and relative comparisons provide additional insight, particularly when metrics span different scales or units, allowing anomalies to be assessed proportionally rather than absolutely.
Comparative analytics also support capacity planning and predictive maintenance. By evaluating trends across systems or workloads, observers can forecast resource demands, identify potential saturation points, and schedule maintenance or scaling activities proactively. These insights enable organizations to maintain operational resilience, optimize performance, and minimize unplanned downtime, all while aligning monitoring strategies with broader business objectives.
Predictive Evaluation and Early Warning Signals
Predictive evaluation leverages historical trends, analytic functions, and statistical models to anticipate future system behavior. Observers use this approach to generate early warning signals, providing opportunities to address emerging issues before they escalate into critical incidents. Metrics serve as leading indicators, and sophisticated analysis can detect subtle deviations that precede performance degradation, service interruptions, or security anomalies. Predictive insights are particularly valuable in dynamic, distributed environments where traditional threshold-based monitoring may not capture complex interdependencies.
The predictive process often involves examining cyclic patterns, seasonal variations, and correlations among multiple metrics. Observers assess the likelihood of future events based on past behavior, integrating data from multi-time series metrics and analytic outputs. This foresight enables proactive interventions, such as scaling resources, adjusting configurations, or prioritizing investigations, thereby enhancing system reliability and operational efficiency. Predictive evaluation transforms monitoring from a reactive task into a strategic tool for maintaining high service levels.
Correlating Metrics for Holistic Insights
Holistic observability requires the correlation of metrics across systems, applications, and infrastructure components. Observers synthesize data from multiple sources, aligning temporal sequences, aggregating multi-dimensional metrics, and analyzing interdependencies. This comprehensive view enables identification of root causes, assessment of systemic risks, and evaluation of operational health across the enterprise. By correlating metrics, professionals can discern whether anomalies in one component reflect isolated events or broader systemic conditions.
Effective correlation depends on accurate configuration of data collection pipelines, collectors, and readers. Metrics must be normalized, time-aligned, and enriched with contextual metadata to ensure meaningful analysis. Observers interpret these correlated datasets to detect cascading failures, emerging bottlenecks, or potential performance degradation. The insights derived from correlated metrics inform alerting strategies, dashboard configurations, and strategic operational decisions, reinforcing the role of analytics as the cornerstone of proactive observability.
Enhancing Decision-Making with Analytics
Analytics empower operational decision-making by translating complex datasets into comprehensible, actionable insights. Observers use analytic outputs to evaluate the performance of infrastructure, applications, and services, guiding interventions that optimize reliability, efficiency, and user experience. By combining real-time monitoring with historical analysis and predictive evaluation, professionals create a continuous feedback loop that informs both immediate responses and long-term strategic planning.
The ability to interpret analytic results requires understanding the interplay between metric resolution, rollups, analytic functions, and visualization techniques. Observers must distinguish between normal variations and meaningful anomalies, contextualize findings within operational environments, and communicate insights effectively to stakeholders. This capability ensures that decisions are data-driven, timely, and aligned with organizational objectives, enhancing operational resilience and efficiency.
Real-World Applications of Analytics in Observability
In practical scenarios, analytics inform a wide range of operational tasks, from incident response to capacity planning. Observers utilize analytic insights to detect early signs of resource exhaustion, latency spikes, or performance degradation, enabling proactive mitigation. Trend analysis supports planning for infrastructure scaling, deployment of additional resources, or optimization of workloads. Predictive evaluation guides maintenance scheduling and risk management, reducing the likelihood of unplanned outages and enhancing service continuity.
Analytics also enhance collaboration among operational teams. By providing a shared understanding of system behavior, trends, and anomalies, teams can coordinate responses, prioritize interventions, and allocate responsibilities effectively. Dashboards enriched with analytic outputs facilitate communication, enabling stakeholders at all levels to comprehend complex metrics, anticipate potential issues, and take informed action. This integration of analytics, visualization, and monitoring creates a cohesive observability framework that supports operational excellence.
Advanced Analytic Techniques
Advanced analytic techniques extend the capabilities of standard metrics evaluation. Observers employ functions such as anomaly detection algorithms, statistical modeling, and correlation analysis to uncover insights that are not apparent from simple aggregation or visualization. Multi-dimensional analysis allows examination of metrics across several attributes, identifying patterns that span system components, application layers, or geographic regions. These techniques enable professionals to detect emerging issues early, understand complex interdependencies, and implement interventions with precision.
By incorporating advanced analytics into dashboards and detectors, observers enhance the predictive power and operational relevance of their monitoring frameworks. This approach allows for dynamic thresholding, adaptive alerting, and context-aware visualization, ensuring that insights remain accurate and actionable even in evolving operational environments. The integration of these techniques supports a proactive and strategic approach to observability, enabling organizations to maintain high performance, reliability, and resilience.
Optimizing Observability Workflows
The combination of analytics, visualization, alerting, and predictive evaluation forms the foundation of optimized observability workflows. Observers design pipelines that capture accurate metrics, process them efficiently, and present insights in an actionable format. Dashboards, detectors, and alerts work synergistically to provide a comprehensive understanding of system health, trends, and potential risks. Optimized workflows reduce response times, enhance situational awareness, and support strategic decision-making.
Observers must continuously refine these workflows, integrating new data sources, updating analytic models, and adapting dashboards to reflect evolving operational priorities. Regular evaluation of alert effectiveness, detector sensitivity, and visualization clarity ensures that monitoring remains relevant, accurate, and impactful. By maintaining an iterative approach to observability, professionals foster resilience, efficiency, and proactive management of complex systems.
Leveraging Metrics for Strategic Decision-Making
The ultimate goal of observability is to support informed and strategic decision-making. Analytics provide the evidence base for evaluating system performance, prioritizing interventions, and allocating resources. Observers translate metric insights into actionable recommendations, guiding operational planning, capacity management, and risk mitigation. Predictive evaluation and trend analysis enable organizations to anticipate future conditions, optimize performance, and maintain high levels of service reliability.
By integrating analytics into decision-making processes, organizations transform raw data into strategic intelligence. Observers bridge the gap between metrics collection and operational action, ensuring that every insight contributes to improved system performance, reduced downtime, and enhanced user experience. The ability to harness analytics effectively positions teams to navigate complex environments with confidence, foresight, and precision.
Conclusion
Mastering analytics, trend analysis, and predictive evaluation in Splunk O11y Cloud empowers observability professionals to extract maximum value from collected metrics. By transforming raw data into actionable insights, analyzing temporal and multi-dimensional patterns, and correlating metrics across systems, observers gain a profound understanding of operational behavior. Dashboards, detectors, and alerts serve as the tools for interpreting, visualizing, and acting upon these insights, creating a comprehensive and proactive monitoring ecosystem. The integration of advanced analytic techniques with predictive evaluation supports strategic decision-making, enhances operational resilience, and ensures that organizations can maintain reliable, efficient, and optimized digital infrastructures. Professionals who excel in these capabilities position themselves as essential contributors to the success of modern observability practices, driving continuous improvement and sustained operational excellence.
Frequently Asked Questions
How can I get the products after purchase?
All products are available for download immediately from your Member's Area. Once you have made the payment, you will be transferred to Member's Area where you can login and download the products you have purchased to your computer.
How long can I use my product? Will it be valid forever?
Test-King products have a validity of 90 days from the date of purchase. This means that any updates to the products, including but not limited to new questions, or updates and changes by our editing team, will be automatically downloaded on to computer to make sure that you get latest exam prep materials during those 90 days.
Can I renew my product if when it's expired?
Yes, when the 90 days of your product validity are over, you have the option of renewing your expired products with a 30% discount. This can be done in your Member's Area.
Please note that you will not be able to use the product after it has expired if you don't renew it.
How often are the questions updated?
We always try to provide the latest pool of questions, Updates in the questions depend on the changes in actual pool of questions by different vendors. As soon as we know about the change in the exam question pool we try our best to update the products as fast as possible.
How many computers I can download Test-King software on?
You can download the Test-King products on the maximum number of 2 (two) computers or devices. If you need to use the software on more than two machines, you can purchase this option separately. Please email support@test-king.com if you need to use more than 5 (five) computers.
What is a PDF Version?
PDF Version is a pdf document of Questions & Answers product. The document file has standart .pdf format, which can be easily read by any pdf reader application like Adobe Acrobat Reader, Foxit Reader, OpenOffice, Google Docs and many others.
Can I purchase PDF Version without the Testing Engine?
PDF Version cannot be purchased separately. It is only available as an add-on to main Question & Answer Testing Engine product.
What operating systems are supported by your Testing Engine software?
Our testing engine is supported by Windows. Andriod and IOS software is currently under development.
Top Splunk Exams
- SPLK-1002 - Splunk Core Certified Power User
- SPLK-1003 - Splunk Enterprise Certified Admin
- SPLK-5001 - Splunk Certified Cybersecurity Defense Analyst
- SPLK-1001 - Splunk Core Certified User
- SPLK-2002 - Splunk Enterprise Certified Architect
- SPLK-3003 - Splunk Core Certified Consultant
- SPLK-4001 - Splunk O11y Cloud Certified Metrics User
- SPLK-1005 - Splunk Cloud Certified Admin
- SPLK-5002 - Splunk Certified Cybersecurity Defense Engineer
- SPLK-3001 - Splunk Enterprise Security Certified Admin
- SPLK-1004 - Splunk Core Certified Advanced Power User
- SPLK-2003 - Splunk SOAR Certified Automation Developer
- SPLK-3002 - Splunk IT Service Intelligence Certified Admin
Splunk Certifications
- Splunk Certified Cybersecurity Defense Analyst
- Splunk Certified Developer
- Splunk Core Certified Consultant
- Splunk Core Certified Power User
- Splunk Core Certified User
- Splunk Enterprise Certified Admin
- Splunk Enterprise Certified Architect
- Splunk Enterprise Security Certified Admin
- Splunk IT Service Intelligence Certified Admin
- Splunk O11y Cloud Certified Metrics User